Peloton Stats to Google Sheets with Data Visualization through Seaborn and Plotly

Overview

Peloton Stats to Google Sheets with Data Visualization through Seaborn and Plotly

Problem: 2 peloton users were looking for a way to track their metrics in a way that was readable and available

Solution: this script. I personally run this at set intervals on a raspberry pi, so access to their data is usable at virtually all hours.

Here's how it works. The code relies on first having built a csv file which contains the headings of 'name', 'username', 'email', and 'password' (for Peloton). The script pulls data from this file and then logs into peloton. From there, it downloads the users CSV data with all of their workout data. For my specific needs, we only cared about cycling data (which you will notice in the code). Several calculations are performed and some clean up is completed on the dataframes. That data is then passed into the user's assigned Google Sheet (which also includes their interactive 'goal' cell used for pace calculations [this resets on the first of each year]. Since I am running on a raspberry pi, I use SMTP to send an email to each user at the end of the day with a daily wrap email.

The script utilizes several dependencies (noted in the code itself). One of the dependencies is based on the google sheets API. Information can be found here: https://developers.google.com/sheets/api

You might also like...
Productivity Tools for Plotly + Pandas

Cufflinks This library binds the power of plotly with the flexibility of pandas for easy plotting. This library is available on https://github.com/san

Custom Plotly Dash components based on Mantine React Components library

Dash Mantine Components Dash Mantine Components is a Dash component library based on Mantine React Components Library. It makes it easier to create go

 A Simple Flask-Plotly Example for NTU 110-1 DSSI Class
A Simple Flask-Plotly Example for NTU 110-1 DSSI Class

A Simple Flask-Plotly Example for NTU 110-1 DSSI Class Live Demo Prerequisites We will use Flask and Ploty to build a Flask application. If you haven'

A shimmer pre-load component for Plotly Dash

dash-loading-shimmer A shimmer pre-load component for Plotly Dash Installation Get it with pip: pip install dash-loading-extras Or maybe you prefer Pi

3D plotting and mesh analysis through a streamlined interface for the Visualization Toolkit (VTK)

PyVista Deployment Build Status Metrics Citation License Community 3D plotting and mesh analysis through a streamlined interface for the Visualization

3D plotting and mesh analysis through a streamlined interface for the Visualization Toolkit (VTK)

PyVista Deployment Build Status Metrics Citation License Community 3D plotting and mesh analysis through a streamlined interface for the Visualization

Create Badges with stats of Scratch User, Project and Studio. Use those badges in Github readmes, etc.

Scratch-Stats-Badge Create customized Badges with stats of Scratch User, Studio or Project. Use those badges in Github readmes, etc. Examples Document

 GitHub Stats Visualizations : Transparent
GitHub Stats Visualizations : Transparent

GitHub Stats Visualizations : Transparent Generate visualizations of GitHub user and repository statistics using GitHub Actions. ⚠️ Disclaimer The pro

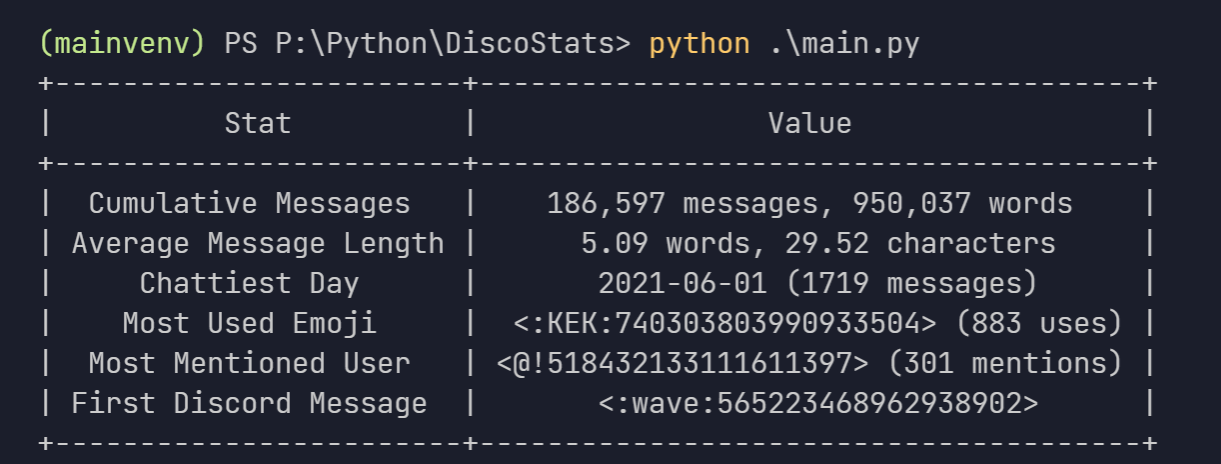
view cool stats related to your discord account.

DiscoStats cool statistics generated using your discord data. How? DiscoStats is not a service that breaks the Discord Terms of Service or Community G

Releases(v2.1.2)
  • v2.1.2(Feb 1, 2022)

    1. added a '--pause' arg to the script to facilitate the pausing for service account quota exceeded errors
    2. Initial push of a google sheet builder

    What's Changed

    • Sheet Build Initial Push by @tychaney in https://github.com/tychaney/Peloton-Data-to-Google-Sheets/pull/3

    Full Changelog: https://github.com/tychaney/Peloton-Data-to-Google-Sheets/compare/v2.1.1...v2.1.2

    Source code(tar.gz)
    Source code(zip)
  • v2.1.1(Jan 31, 2022)

    Minor bug fix from 2.1.0 Corrected the monthly pace calculation

    What's Changed

    • v 2.1.0 by @tychaney in https://github.com/tychaney/Peloton-Data-to-Google-Sheets/pull/2

    Full Changelog: https://github.com/tychaney/Peloton-Data-to-Google-Sheets/compare/v2.1.0...v2.1.1

    Source code(tar.gz)
    Source code(zip)
Python script for writing text on github contribution chart.

Github Contribution Drawer Python script for writing text on github contribution chart. Requirements Python 3.X Getting Started Create repository Put

Steven 0 May 27, 2022
Multi-class confusion matrix library in Python

Table of contents Overview Installation Usage Document Try PyCM in Your Browser Issues & Bug Reports Todo Outputs Dependencies Contribution References

Sepand Haghighi 1.3k Dec 31, 2022
FURY - A software library for scientific visualization in Python

Free Unified Rendering in Python A software library for scientific visualization in Python. General Information • Key Features • Installation • How to

169 Dec 21, 2022
daily report of @arkinvest ETF activity + data collection

ark_invest daily weekday report of @arkinvest ETF activity + data collection This script was created to: Extract and save daily csv's from ARKInvest's

T D 27 Jan 02, 2023
A Python library created to assist programmers with complex mathematical functions

libmaths was created not only as a learning experience for me, but as a way to make mathematical models in seconds for Python users using mat

Simple 73 Oct 02, 2022
A small tool to test and visualize protein embeddings and amino acid proportions.

polyprotein_stats A small tool to test and visualize protein embeddings and amino acid proportions. Currently deployed on streamlit.io. Given a set of

2 Jan 07, 2023
Easily convert matplotlib plots from Python into interactive Leaflet web maps.

mplleaflet mplleaflet is a Python library that converts a matplotlib plot into a webpage containing a pannable, zoomable Leaflet map. It can also embe

Jacob Wasserman 502 Dec 28, 2022
Yata is a fast, simple and easy Data Visulaization tool, running on python dash

Yata is a fast, simple and easy Data Visulaization tool, running on python dash. The main goal of Yata is to provide a easy way for persons with little programming knowledge to visualize their data e

Cybercreek 3 Jun 28, 2021
An interactive UMAP visualization of the MNIST data set.

Code for an interactive UMAP visualization of the MNIST data set. Demo at https://grantcuster.github.io/umap-explorer/. You can read more about the de

grant 70 Dec 27, 2022
Generate SVG (dark/light) images visualizing (private/public) GitHub repo statistics for profile/website.

Generate daily updated visualizations of GitHub user and repository statistics from the GitHub API using GitHub Actions for any combination of private and public repositories, whether owned or contri

Adam Ross 2 Dec 16, 2022
Python package to Create, Read, Write, Edit, and Visualize GSFLOW models

pygsflow pyGSFLOW is a python package to Create, Read, Write, Edit, and Visualize GSFLOW models API Documentation pyGSFLOW API documentation can be fo

pyGSFLOW 21 Dec 14, 2022
LabGraph is a a Python-first framework used to build sophisticated research systems with real-time streaming, graph API, and parallelism.

LabGraph is a a Python-first framework used to build sophisticated research systems with real-time streaming, graph API, and parallelism.

MLH Fellowship 7 Oct 05, 2022
Tools for exploratory data analysis in Python

Dora Exploratory data analysis toolkit for Python. Contents Summary Setup Usage Reading Data & Configuration Cleaning Feature Selection & Extraction V

Nathan Epstein 599 Dec 25, 2022
Runtime analysis of code with plotting

Runtime analysis of code with plotting A quick comparison among Python, Cython, and the C languages A Programming Assignment regarding the Programming

Cena Ashoori 2 Dec 24, 2021
DALLE-tools provided useful dataset utilities to improve you workflow with WebDatasets.

DALLE tools DALLE-tools is a github repository with useful tools to categorize, annotate or check the sanity of your datasets. Installation Just clone

11 Dec 25, 2022
Geospatial Data Visualization using PyGMT

Example script to visualize topographic data, earthquake data, and tomographic data on a map

Utpal Kumar 2 Jul 30, 2022
Automate the case review on legal case documents and find the most critical cases using network analysis

Automation on Legal Court Cases Review This project is to automate the case review on legal case documents and find the most critical cases using netw

Yi Yin 7 Dec 28, 2022
Simple function to plot multiple barplots in the same figure.

Simple function to plot multiple barplots in the same figure. Supports padding and custom color.

Matthias Jakobs 2 Feb 21, 2022
Collection of scripts for making high quality beautiful math-related posters.

Poster Collection of scripts for making high quality beautiful math-related posters. The poster can have as large printing size as 3x2 square feet wit

Nattawut Phetmak 3 Jun 09, 2022
Automatization of BoxPlot graph usin Python MatPlotLib and Excel

BoxPlotGraphAutomation Automatization of BoxPlot graph usin Python / Excel. This file is an automation of BoxPlot-Graph using python graph library mat

EricAugustin 1 Feb 07, 2022