Streaming pivot visualization via WebAssembly

Overview

Perspective

npm PyPI Build Status FINOS - Active

Perspective is an interactive visualization component for large, real-time datasets. Originally developed for J.P. Morgan's trading business, Perspective makes it simple to build user-configurable analytics entirely in the browser, or in concert with Python and/or JupyterLab. Use it to create reports, dashboards, notebooks and applications, with static data or streaming updates via Apache Arrow.

Features

  • A fast, memory efficient streaming query engine, written in C++ and compiled for both WebAssembly and Python, with read/write/stream/virtual support for Apache Arrow.

  • A framework-agnostic User Interface component and Jupyterlab Widget, over WebWorker (WebAssembly) or WebSocket (Python/Node), and a suite of Datagrid and D3FC Chart plugins. `
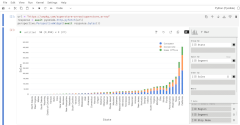
Examples

Superstore Olympics Custom Styles
Editable Streaming CSV
IEX Cloud NYC Citibike JupyterLab Plugin

Documentation

Owner
The Fintech Open Source Foundation (www.finos.org)
FINOS’ mission is to promote open innovation in financial services. See our full list of repos from our nearly 100 projects & 11 programs at finos.github.io
The Fintech Open Source Foundation (www.finos.org)
Interactive plotting for Pandas using Vega-Lite

pdvega: Vega-Lite plotting for Pandas Dataframes pdvega is a library that allows you to quickly create interactive Vega-Lite plots from Pandas datafra

Altair 342 Oct 26, 2022
This Crash Course will cover all you need to know to start using Plotly in your projects.

Plotly Crash Course This course was designed to help you get started using Plotly. If you ever felt like your data visualization skills could use an u

Fábio Neves 2 Aug 21, 2022
NW 2022 Hackathon Project by Angelique Clara Hanzel, Aryan Sonik, Damien Fung, Ramit Brata Biswas

Spiral-Data-Visualizer NW 2022 Hackathon Project by Angelique Clara Hanzell, Aryan Sonik, Damien Fung, Ramit Brata Biswas Description This project vis

Damien Fung 2 Jan 16, 2022
Active Transport Analytics Model (ATAM) is a new strategic transport modelling and data visualization framework for Active Transport as well as emerging micro-mobility modes

{ATAM} Active Transport Analytics Model Active Transport Analytics Model (“ATAM”) is a new strategic transport modelling and data visualization framew

Peter Stephan 0 Jan 12, 2022
Matplotlib colormaps from the yt project !

cmyt Matplotlib colormaps from the yt project ! Colormaps overview The following colormaps, as well as their respective reversed (*_r) versions are av

The yt project 5 Sep 16, 2022
Easily configurable, chart dashboards from any arbitrary API endpoint. JSON config only

Flask JSONDash Easily configurable, chart dashboards from any arbitrary API endpoint. JSON config only. Ready to go. This project is a flask blueprint

Chris Tabor 3.3k Dec 31, 2022
Matplotlib JOTA style for making figures

Matplotlib JOTA style for making figures This repo has Matplotlib JOTA style to format plots and figures for publications and presentation.

JOTA JORNALISMO 2 May 05, 2022
2D maze path solver visualizer implemented with python

2D maze path solver visualizer implemented with python

SS 14 Dec 21, 2022
Interactive Dashboard for Visualizing OSM Data Change

Dashboard and intuitive data downloader for more interactive experience with interpreting osm change data.

1 Feb 20, 2022
Python histogram library - histograms as updateable, fully semantic objects with visualization tools. [P]ython [HYST]ograms.

physt P(i/y)thon h(i/y)stograms. Inspired (and based on) numpy.histogram, but designed for humans(TM) on steroids(TM). The goal is to unify different

Jan Pipek 120 Dec 08, 2022
Automatically generate GitHub activity!

Commit Bot Automatically generate GitHub activity! We've all wanted to be the developer that commits every day, but that requires a lot of work. Let's

Ricky 4 Jun 07, 2022
Pebble is a stat's visualization tool, this will provide a skeleton to develop a monitoring tool.

Pebble is a stat's visualization tool, this will provide a skeleton to develop a monitoring tool.

Aravind Kumar G 2 Nov 17, 2021
Sky attention heatmap of submissions to astrometry.net

astroheat Installation Requires Python 3.6+, Tested with Python 3.9.5 Install library dependencies pip install -r requirements.txt The program require

4 Jun 20, 2022
A Python-based non-fungible token (NFT) generator built using Samilla and Matplotlib

PyNFT A Pythonic NF (non-fungible token) generator built using Samilla and Matplotlib Use python pynft.py [amount] The intention behind this generato

Ayush Gundawar 6 Feb 07, 2022
Time series visualizer is a flexible extension that provides filling world map by country from real data.

Time-series-visualizer Time series visualizer is a flexible extension that provides filling world map by country from csv or json file. You can know d

Long Ng 3 Jul 09, 2021
A python-generated website for visualizing the novel coronavirus (COVID-19) data for Greece.

COVID-19-Greece A python-generated website for visualizing the novel coronavirus (COVID-19) data for Greece. Data sources Data provided by Johns Hopki

Isabelle Viktoria Maciohsek 23 Jan 03, 2023
kyle's vision of how datadog's python client should look

kyle's datadog python vision/proposal not for production use See examples/comprehensive.py for a mostly working example of the proposed API. 📈 🐶 ❤️

Kyle Verhoog 2 Nov 21, 2021
A custom qq-plot for two sample data comparision

QQ-Plot 2 Sample Just a gist to include the custom code to draw a qq-plot in python when dealing with a "two sample problem". This means when u try to

1 Dec 20, 2021
A collection of 100 Deep Learning images and visualizations

A collection of Deep Learning images and visualizations. The project has been developed by the AI Summer team and currently contains almost 100 images.

AI Summer 65 Sep 12, 2022
Open-source demos hosted on Dash Gallery

Dash Sample Apps This repository hosts the code for over 100 open-source Dash apps written in Python or R. They can serve as a starting point for your

Plotly 2.7k Jan 07, 2023