🎨 Python Echarts Plotting Library

Overview

pyecharts logo

pyecharts

Python ❤️ ECharts = pyecharts

Travis Build Status Appveyor Build Status Codecov Package version PyPI - Python Version

PyPI - Format Contributions welcome License

English README

📣 简介

Apache ECharts (incubating) 是一个由百度开源的数据可视化,凭借着良好的交互性,精巧的图表设计,得到了众多开发者的认可。而 Python 是一门富有表达力的语言,很适合用于数据处理。当数据分析遇上数据可视化时,pyecharts 诞生了。

特性

  • 简洁的 API 设计,使用如丝滑般流畅,支持链式调用
  • 囊括了 30+ 种常见图表,应有尽有
  • 支持主流 Notebook 环境,Jupyter Notebook 和 JupyterLab
  • 可轻松集成至 Flask,Sanic,Django 等主流 Web 框架
  • 高度灵活的配置项,可轻松搭配出精美的图表
  • 详细的文档和示例,帮助开发者更快的上手项目
  • 多达 400+ 地图文件,并且支持原生百度地图,为地理数据可视化提供强有力的支持

版本

v0.5.x 和 V1 间不兼容,V1 是一个全新的版本,详见 ISSUE#892ISSUE#1033

V0.5.x

支持 Python2.7,3.4+

经开发团队决定,0.5.x 版本将不再进行维护,0.5.x 版本代码位于 05x 分支,文档位于 05x-docs.pyecharts.org

V1

仅支持 Python3.6+

新版本系列将从 v1.0.0 开始,文档位于 pyecharts.org;示例位于 gallery.pyecharts.org

🔰 安装

pip 安装

# 安装 v1 以上版本
$ pip install pyecharts -U

# 如果需要安装 0.5.11 版本的开发者,可以使用
# pip install pyecharts==0.5.11

源码安装

# 安装 v1 以上版本
$ git clone https://github.com/pyecharts/pyecharts.git
# 如果需要安装 0.5.11 版本,请使用 git clone https://github.com/pyecharts/pyecharts.git -b v05x
$ cd pyecharts
$ pip install -r requirements.txt
$ python setup.py install

📝 使用

本地环境

生成 HTML

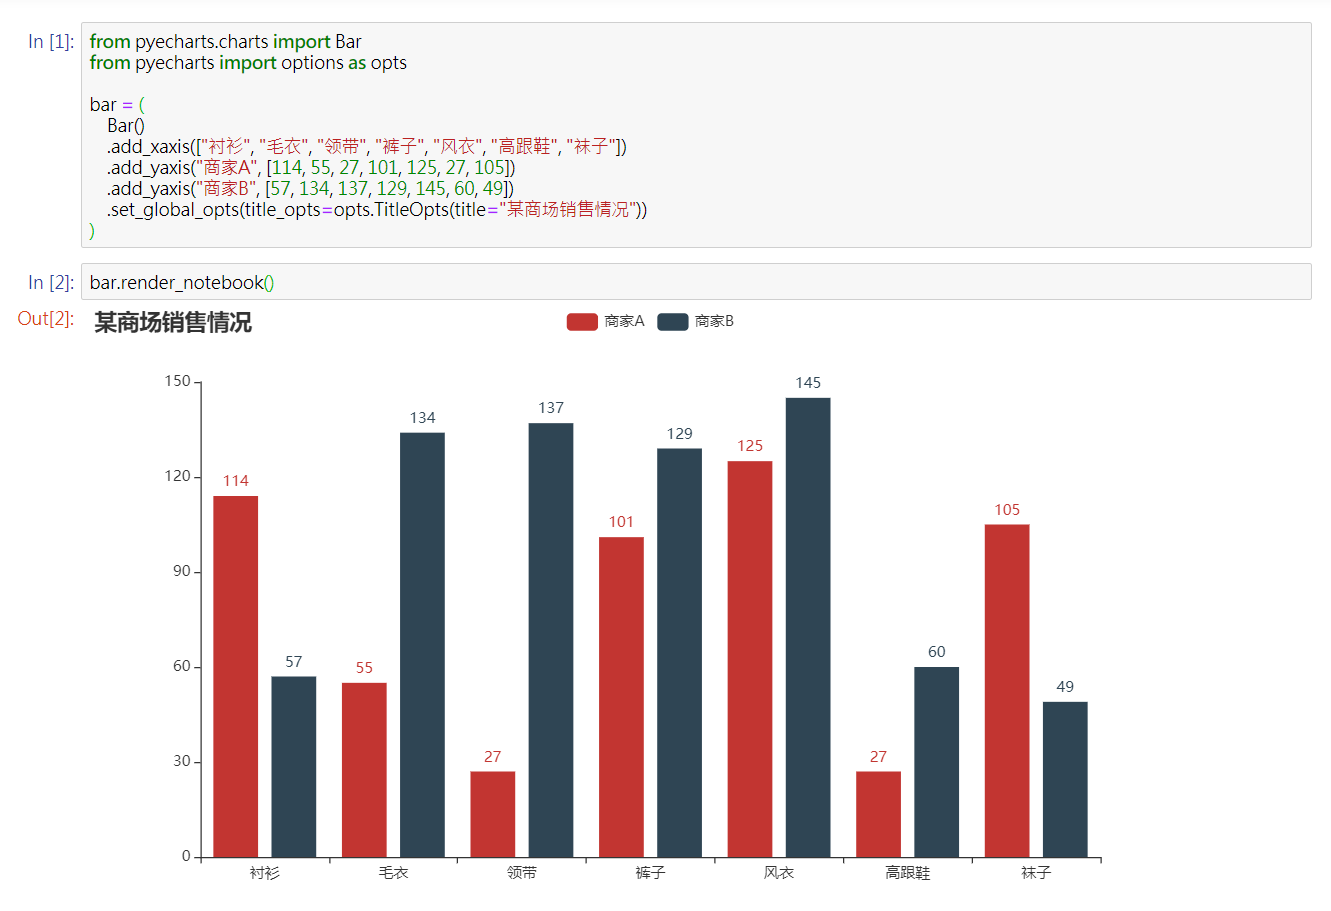
from pyecharts.charts import Bar
from pyecharts import options as opts

# V1 版本开始支持链式调用
bar = (
    Bar()
    .add_xaxis(["衬衫", "毛衣", "领带", "裤子", "风衣", "高跟鞋", "袜子"])
    .add_yaxis("商家A", [114, 55, 27, 101, 125, 27, 105])
    .add_yaxis("商家B", [57, 134, 137, 129, 145, 60, 49])
    .set_global_opts(title_opts=opts.TitleOpts(title="某商场销售情况"))
)
bar.render()

# 不习惯链式调用的开发者依旧可以单独调用方法
bar = Bar()
bar.add_xaxis(["衬衫", "毛衣", "领带", "裤子", "风衣", "高跟鞋", "袜子"])
bar.add_yaxis("商家A", [114, 55, 27, 101, 125, 27, 105])
bar.add_yaxis("商家B", [57, 134, 137, 129, 145, 60, 49])
bar.set_global_opts(title_opts=opts.TitleOpts(title="某商场销售情况"))
bar.render()

生成图片

from snapshot_selenium import snapshot as driver

from pyecharts import options as opts
from pyecharts.charts import Bar
from pyecharts.render import make_snapshot


def bar_chart() -> Bar:
    c = (
        Bar()
        .add_xaxis(["衬衫", "毛衣", "领带", "裤子", "风衣", "高跟鞋", "袜子"])
        .add_yaxis("商家A", [114, 55, 27, 101, 125, 27, 105])
        .add_yaxis("商家B", [57, 134, 137, 129, 145, 60, 49])
        .reversal_axis()
        .set_series_opts(label_opts=opts.LabelOpts(position="right"))
        .set_global_opts(title_opts=opts.TitleOpts(title="Bar-测试渲染图片"))
    )
    return c

# 需要安装 snapshot-selenium 或者 snapshot-phantomjs
make_snapshot(driver, bar_chart().render(), "bar.png")

Notebook 环境

Jupyter Notebook

JupyterLab

Web 框架

🔖 Demo

Demo 代码位于 example 文件夹下,欢迎参考 pyecharts 画廊 pyecharts-gallery

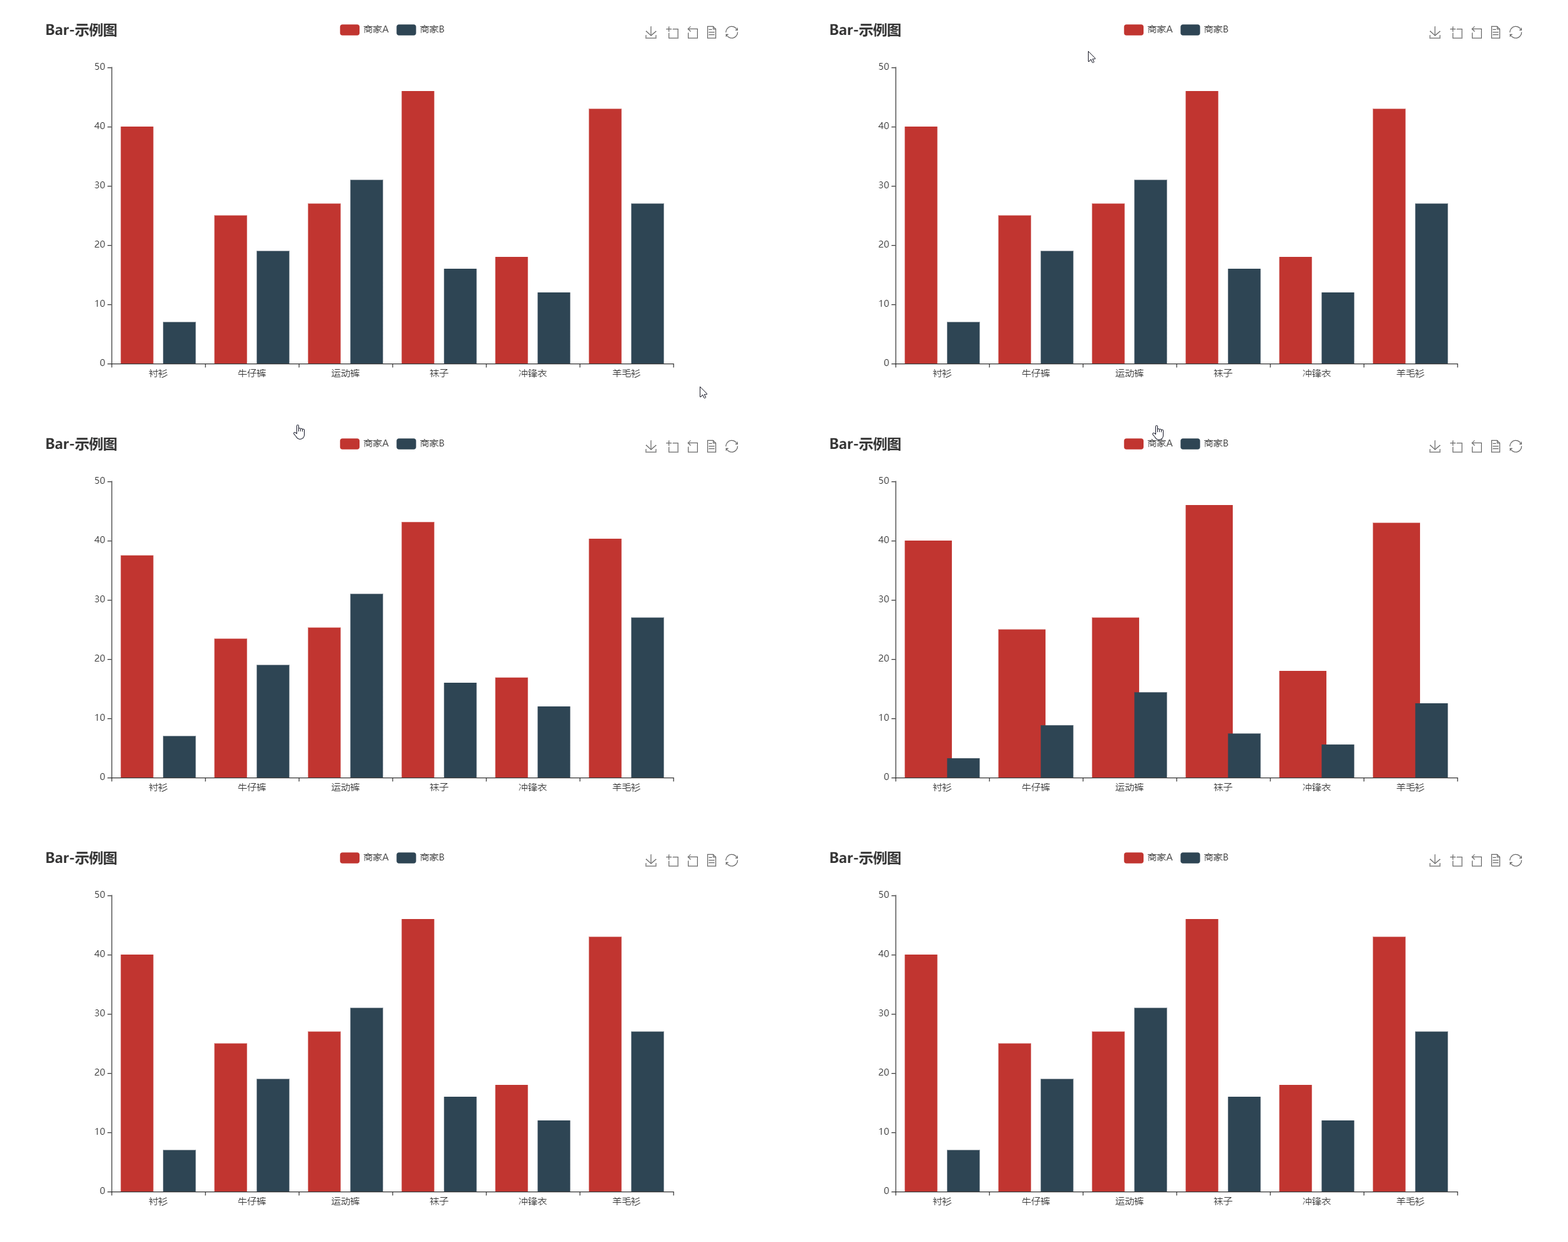
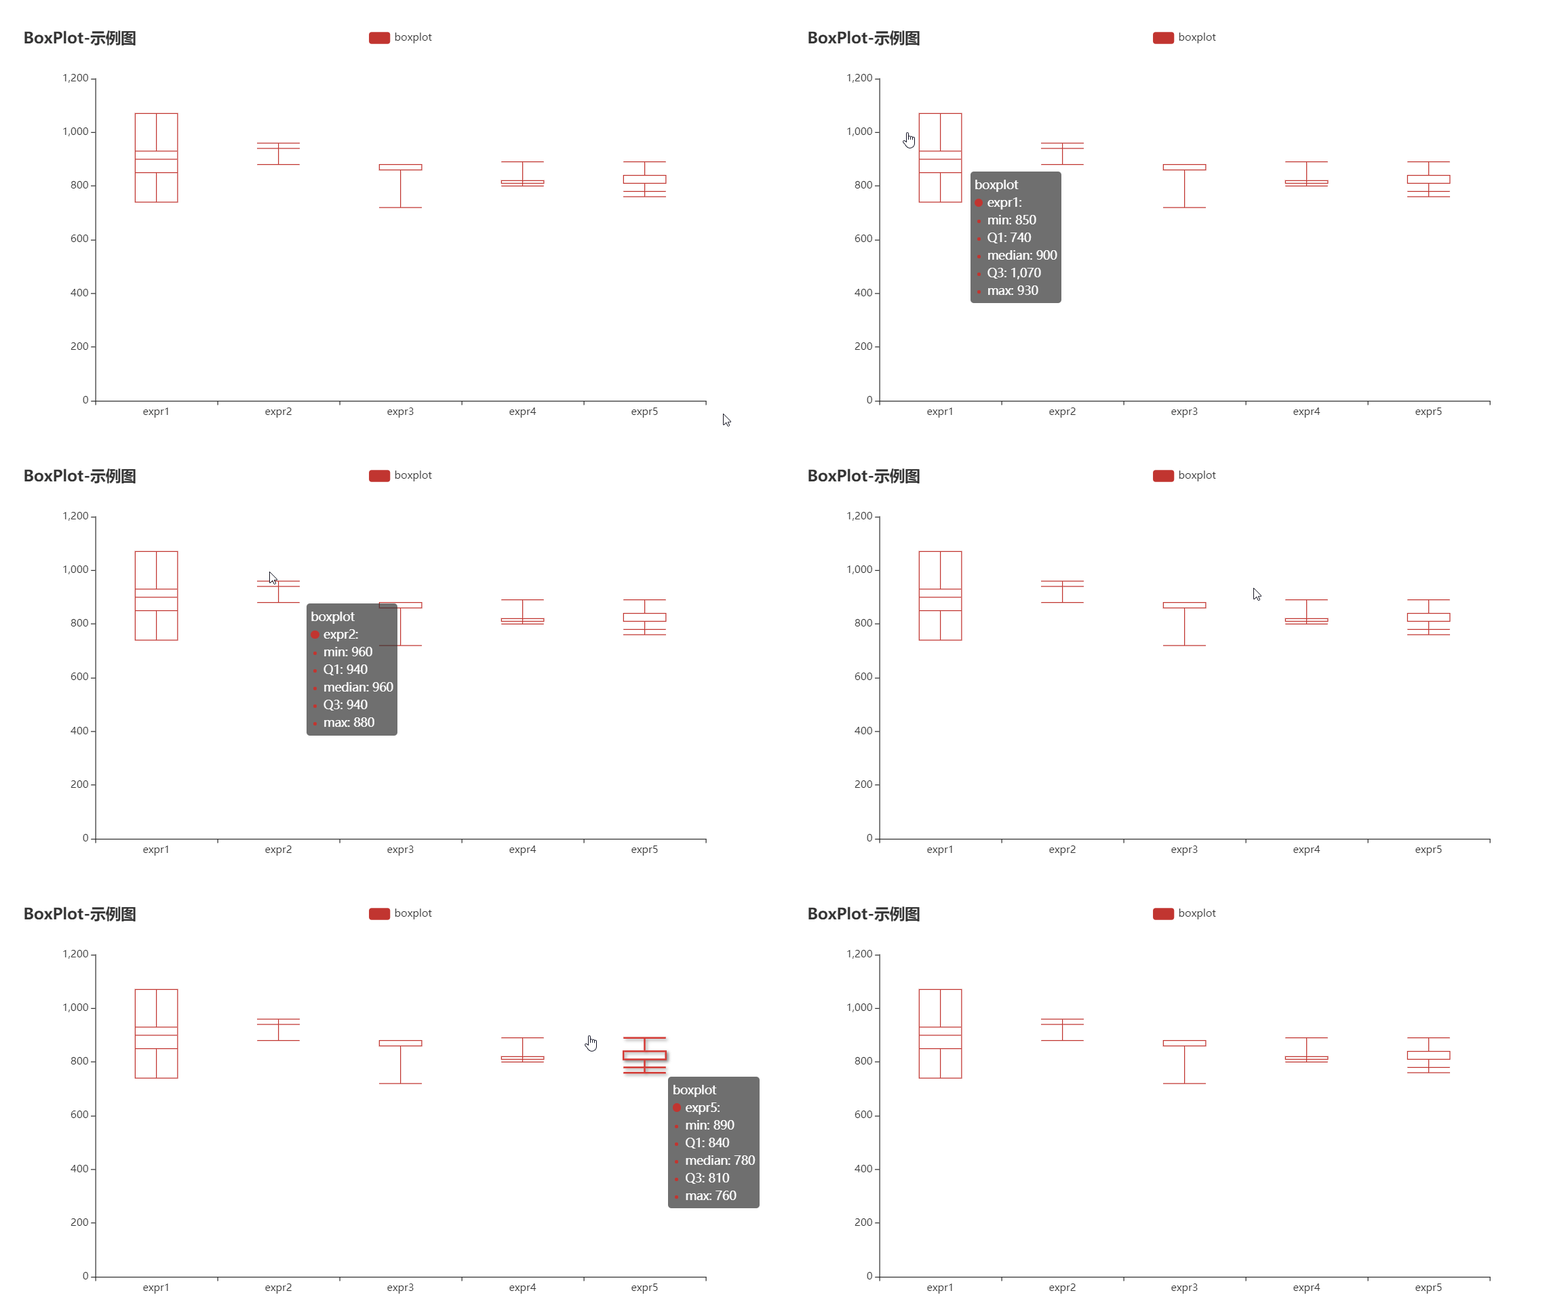
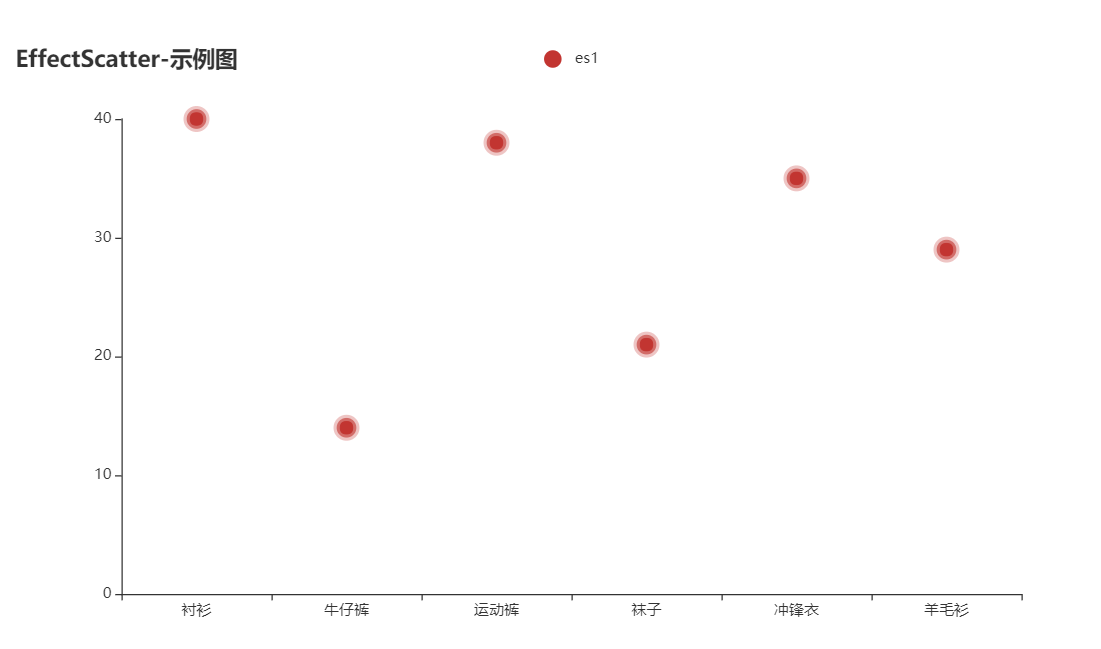
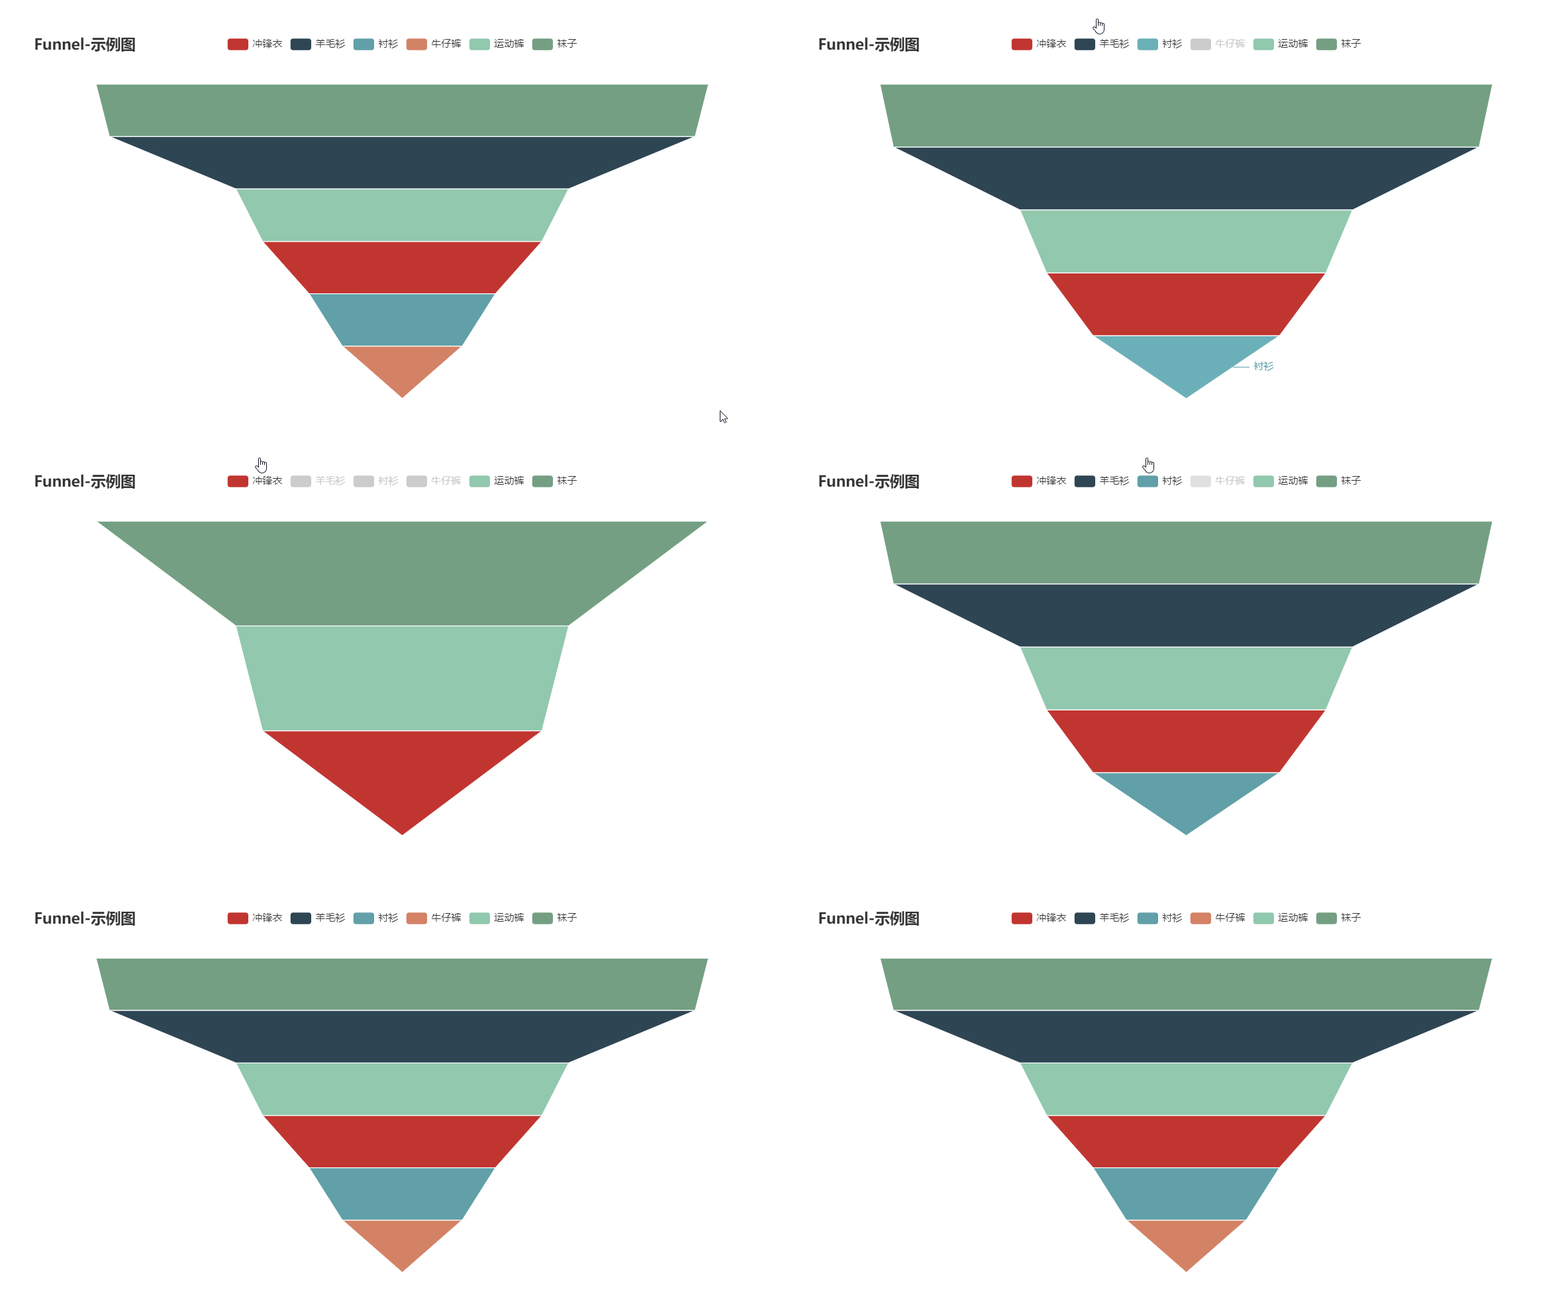
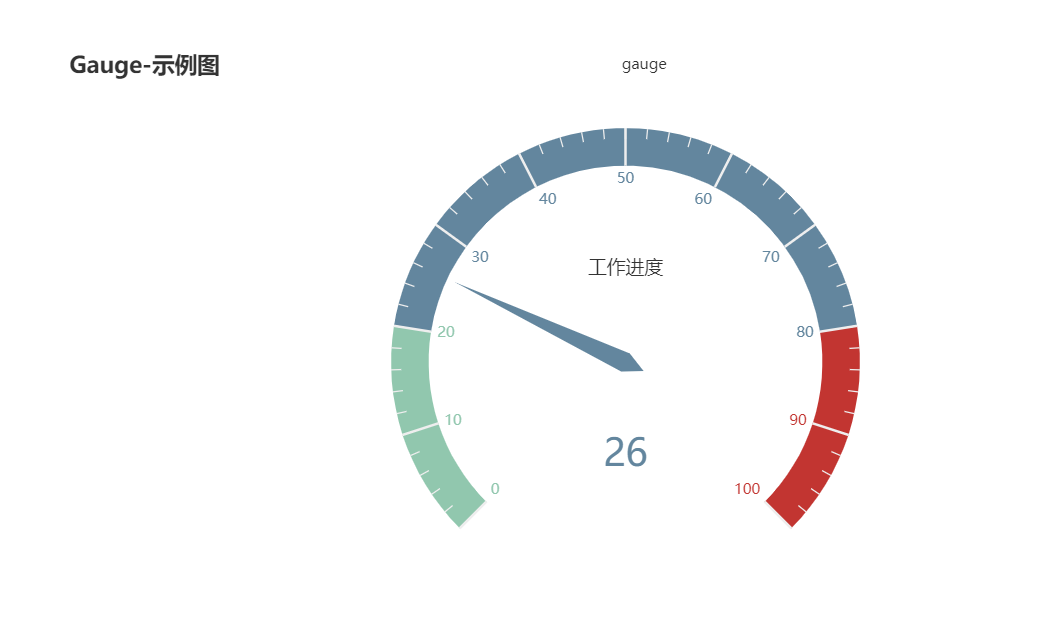
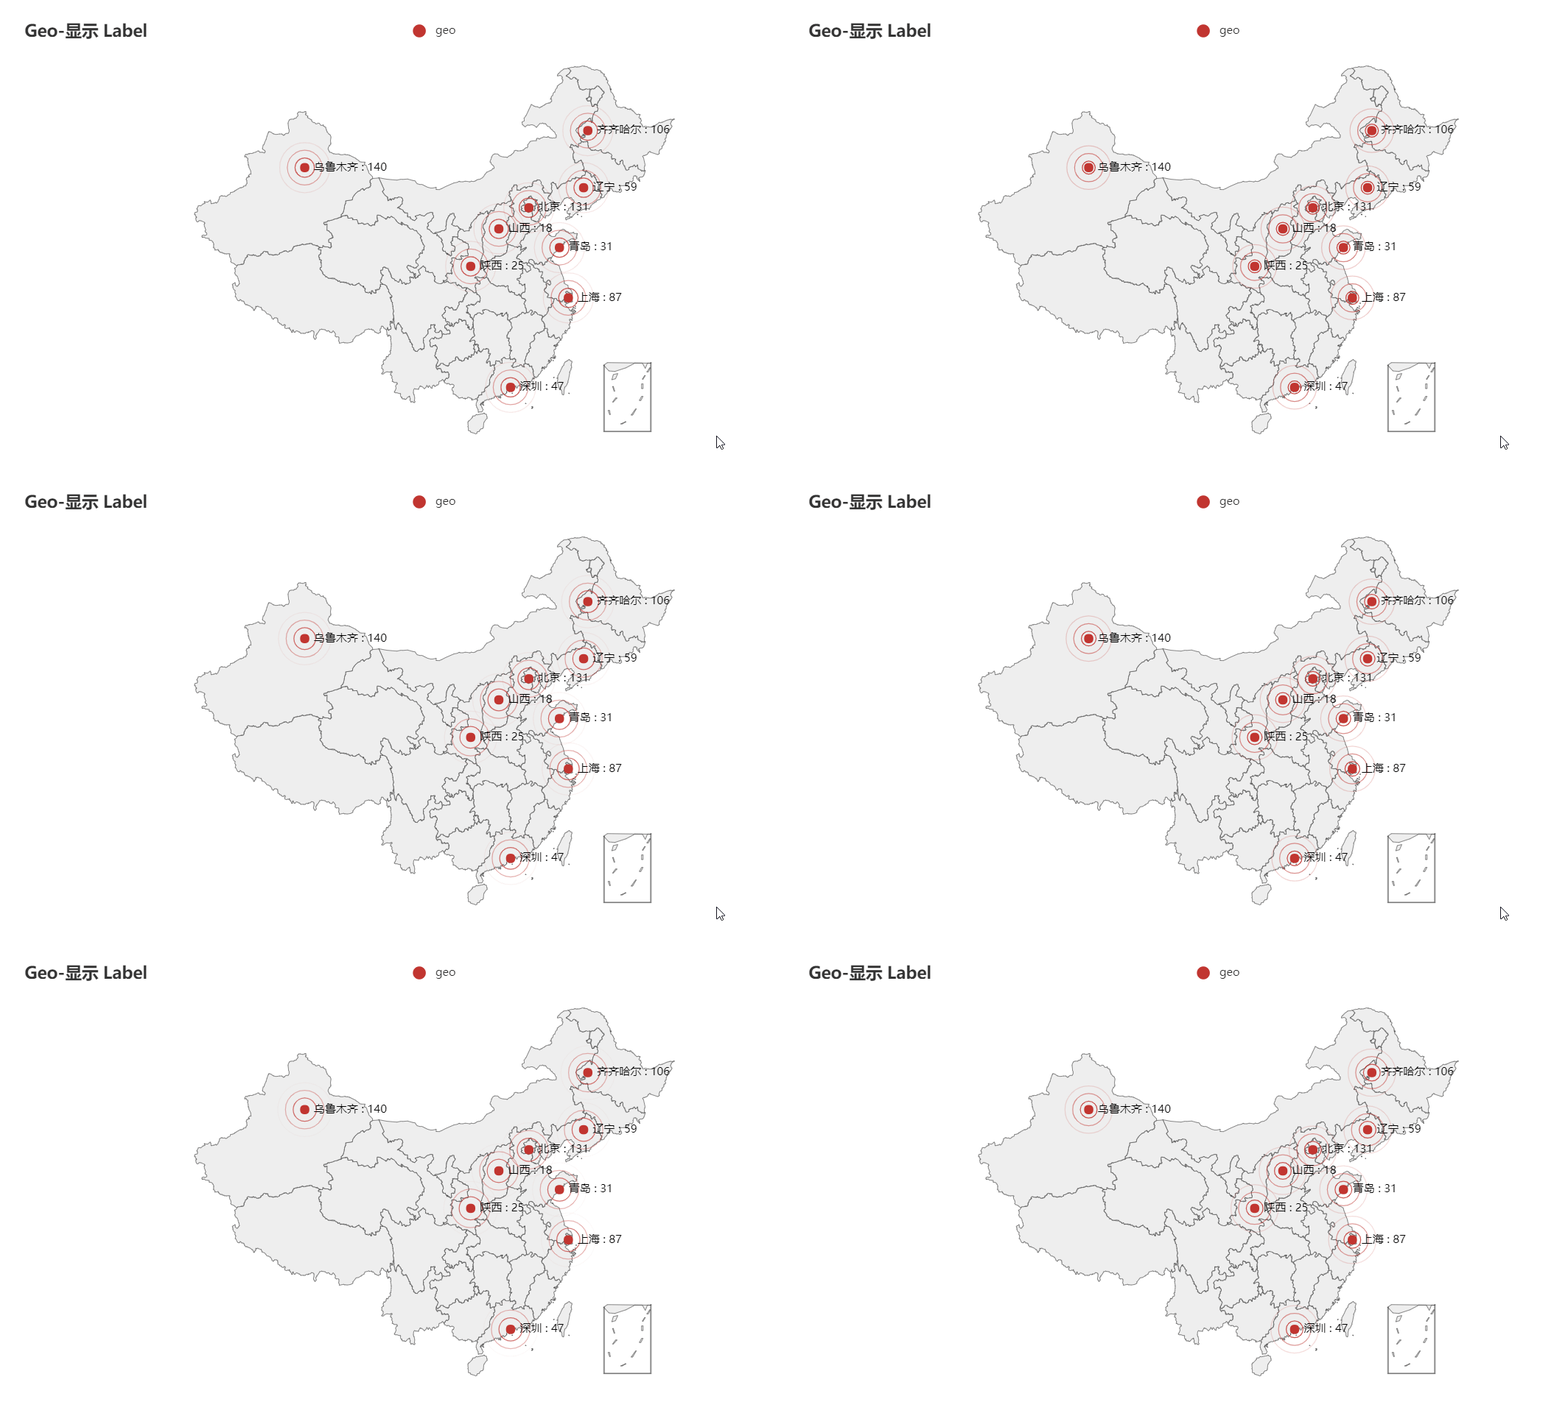
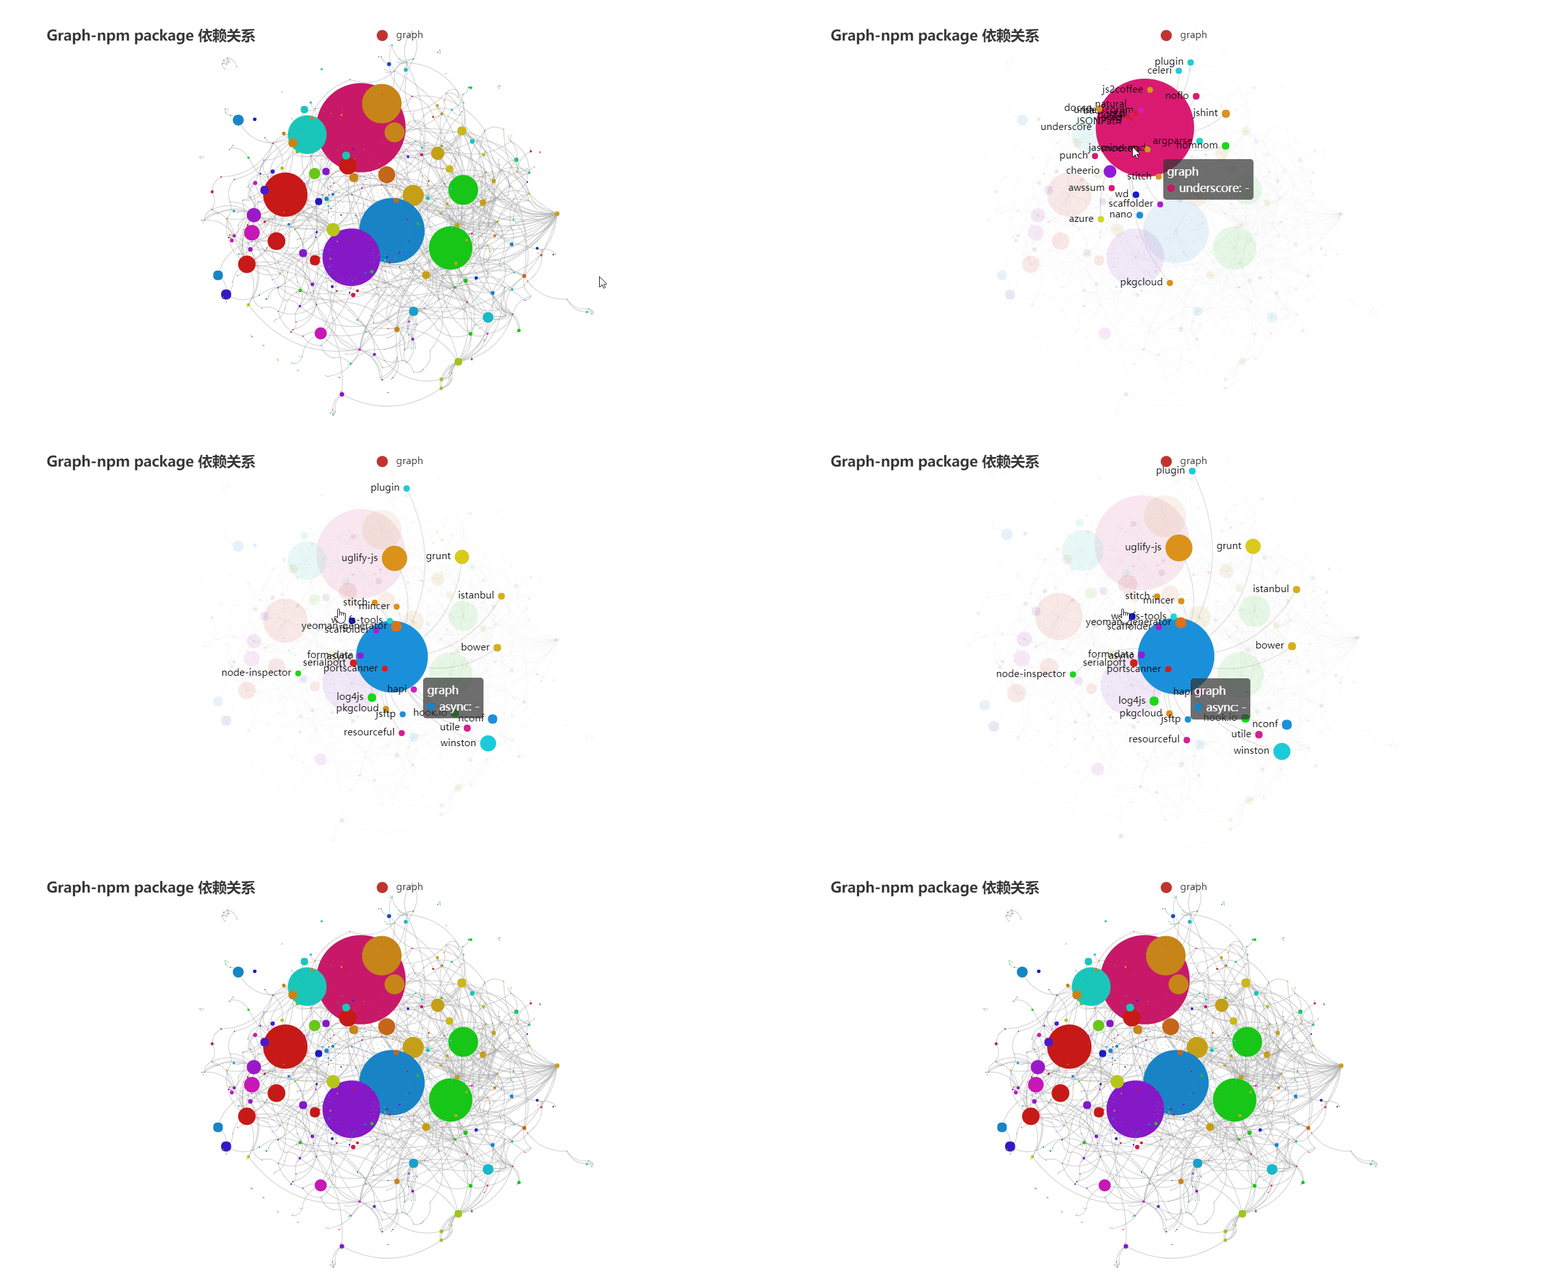
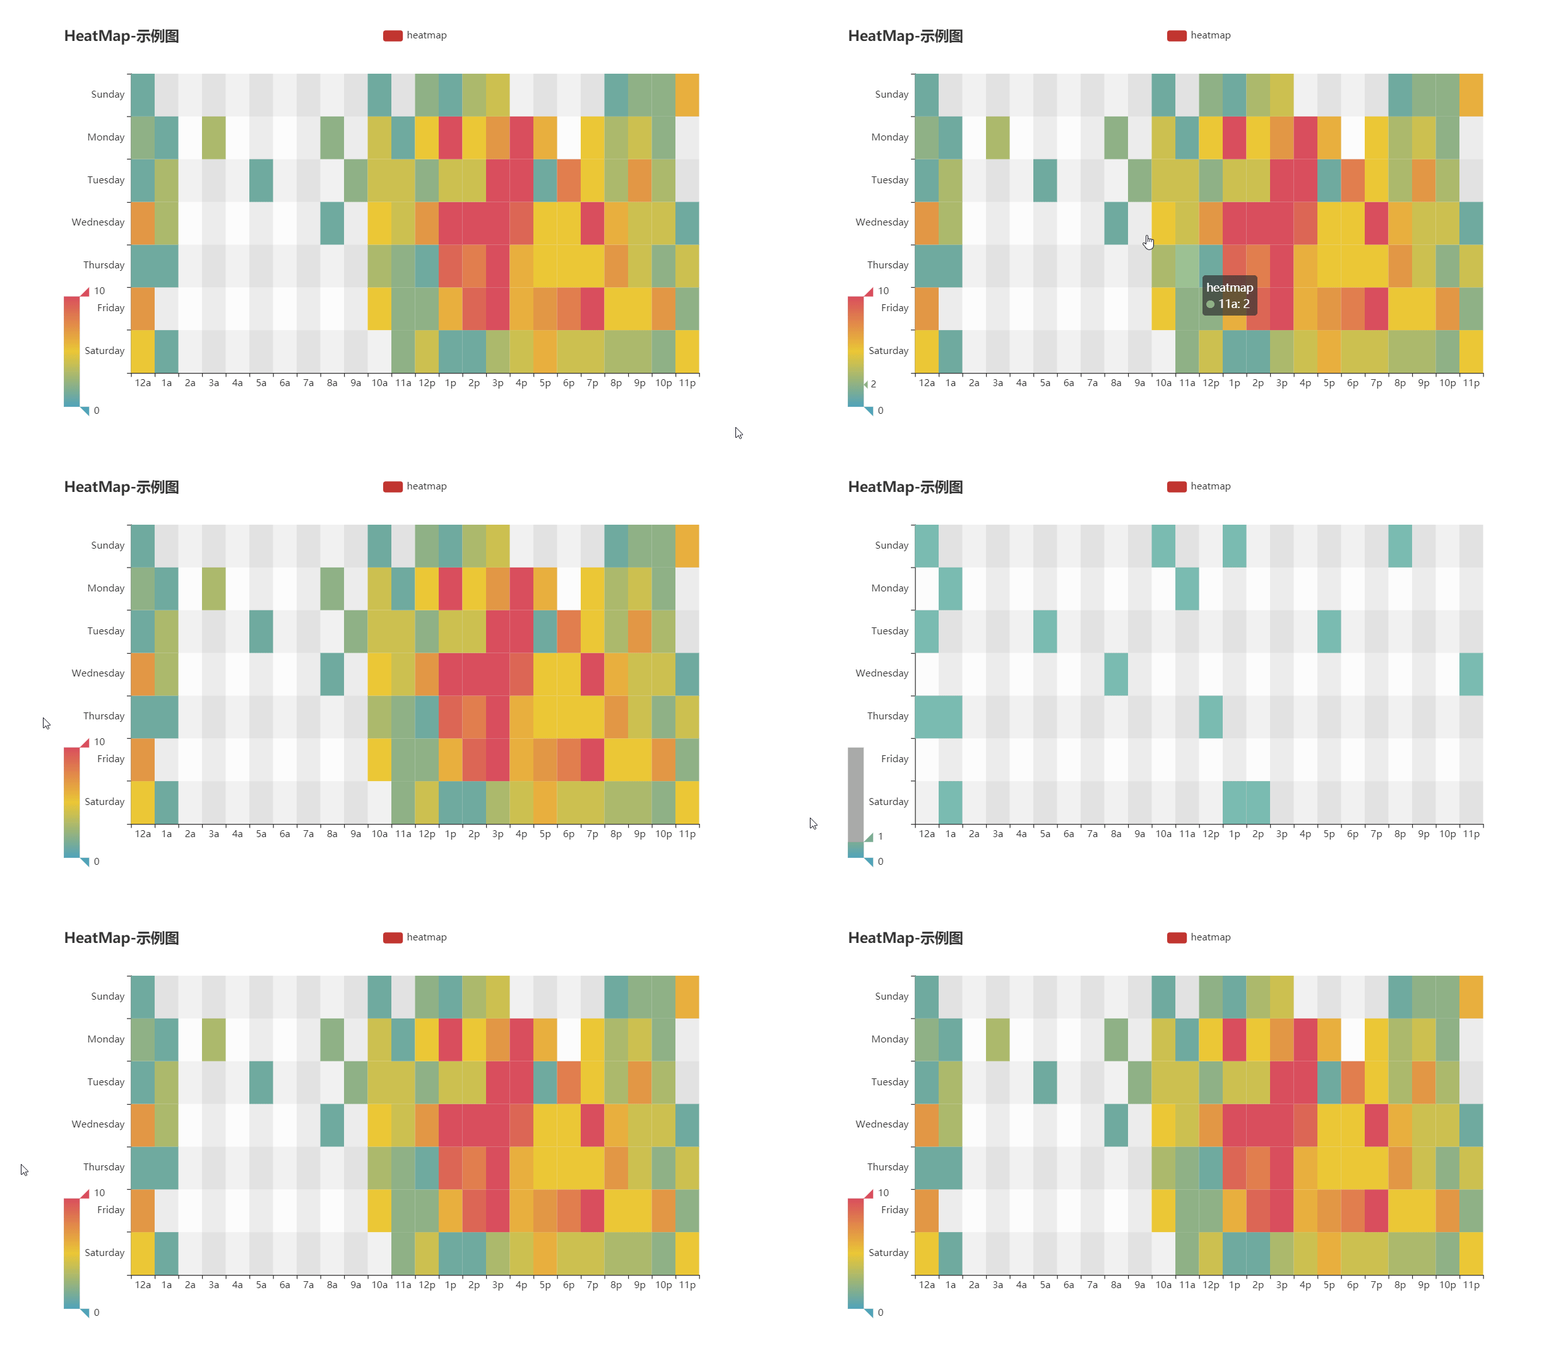
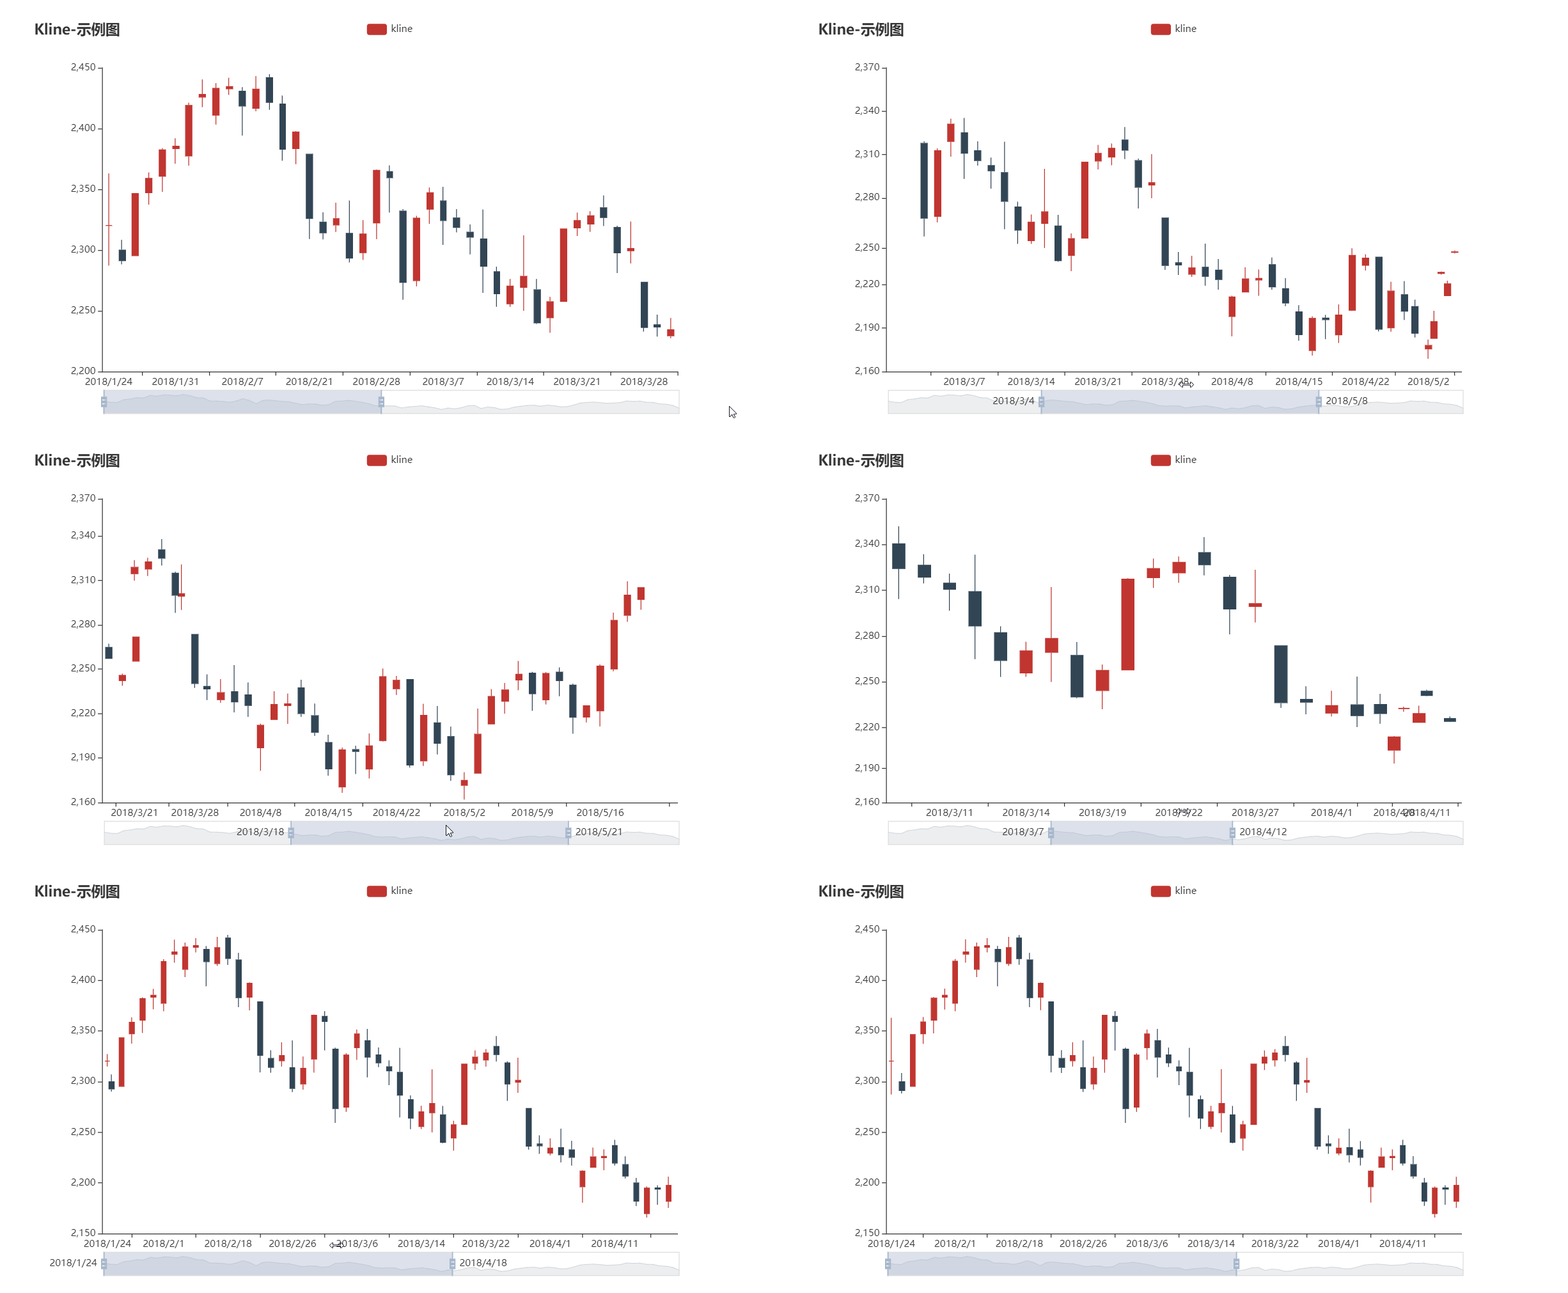
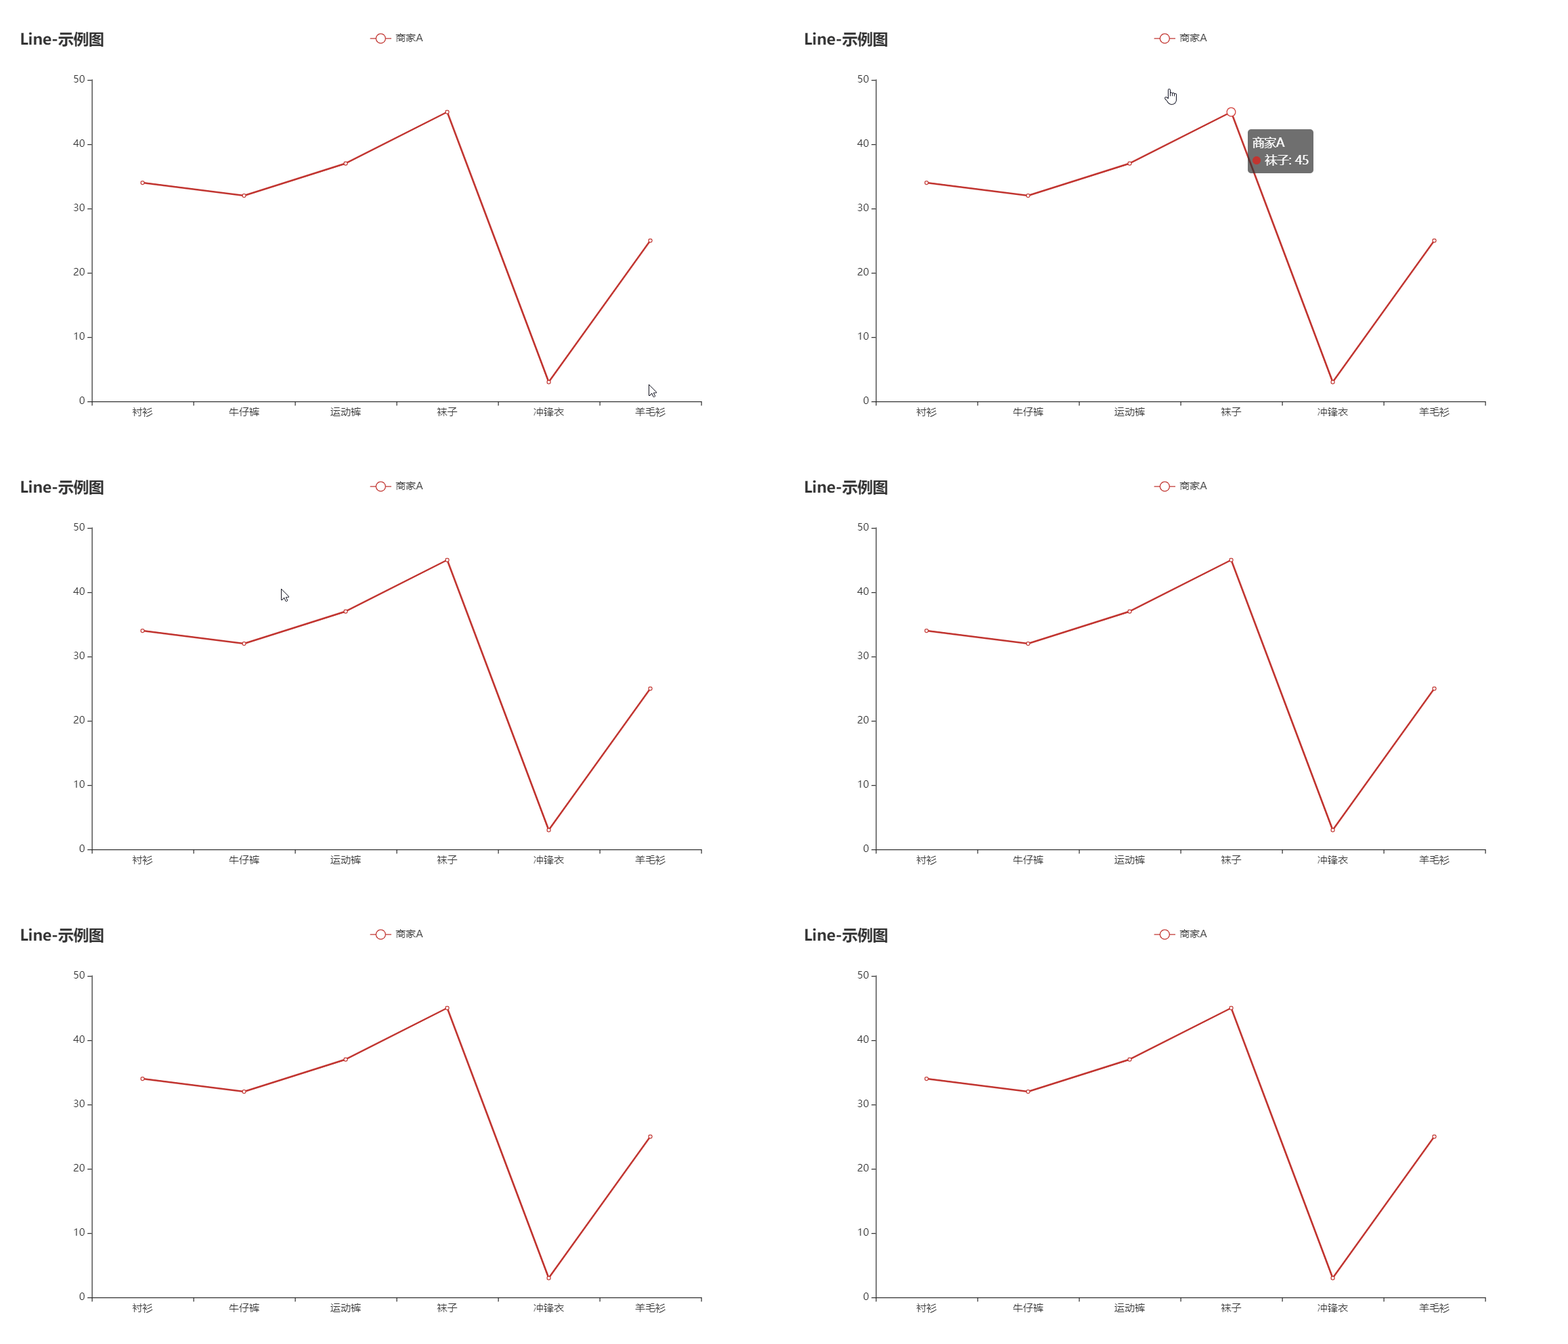
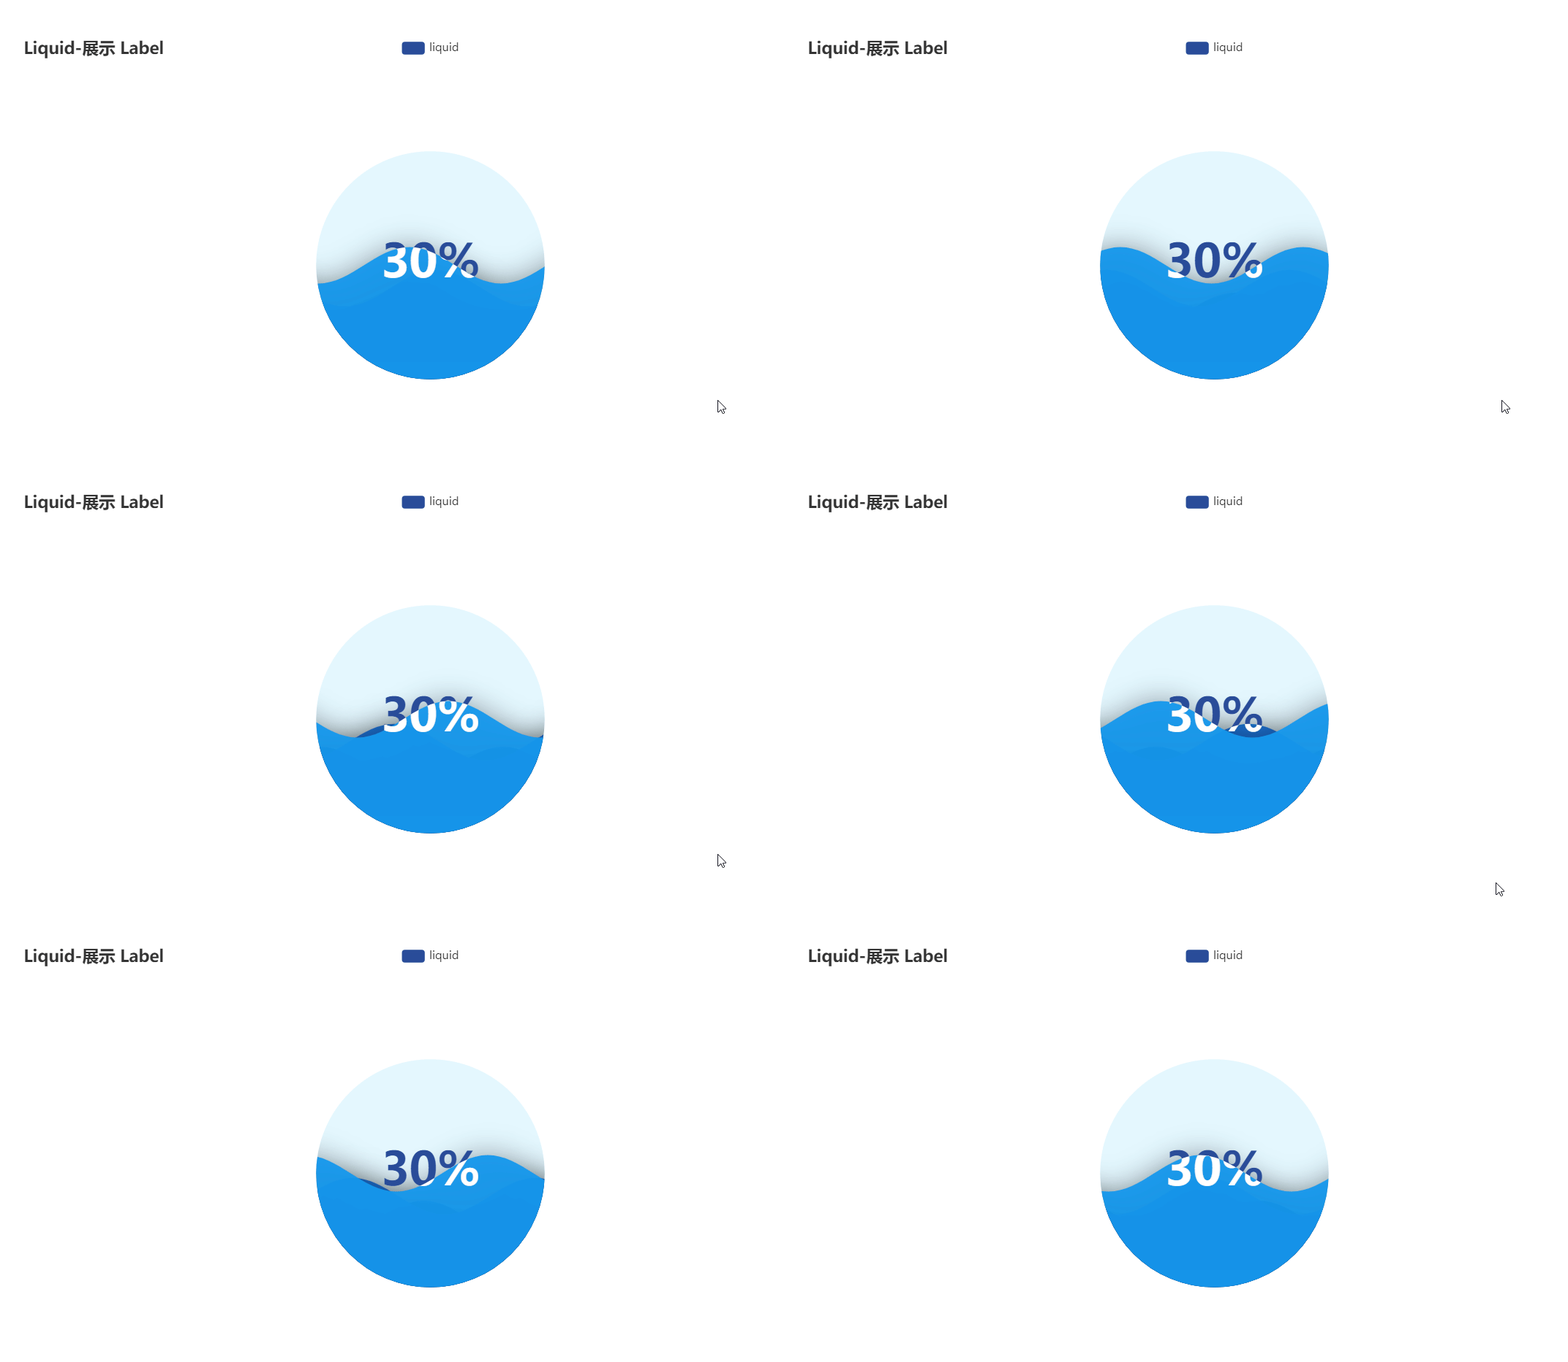
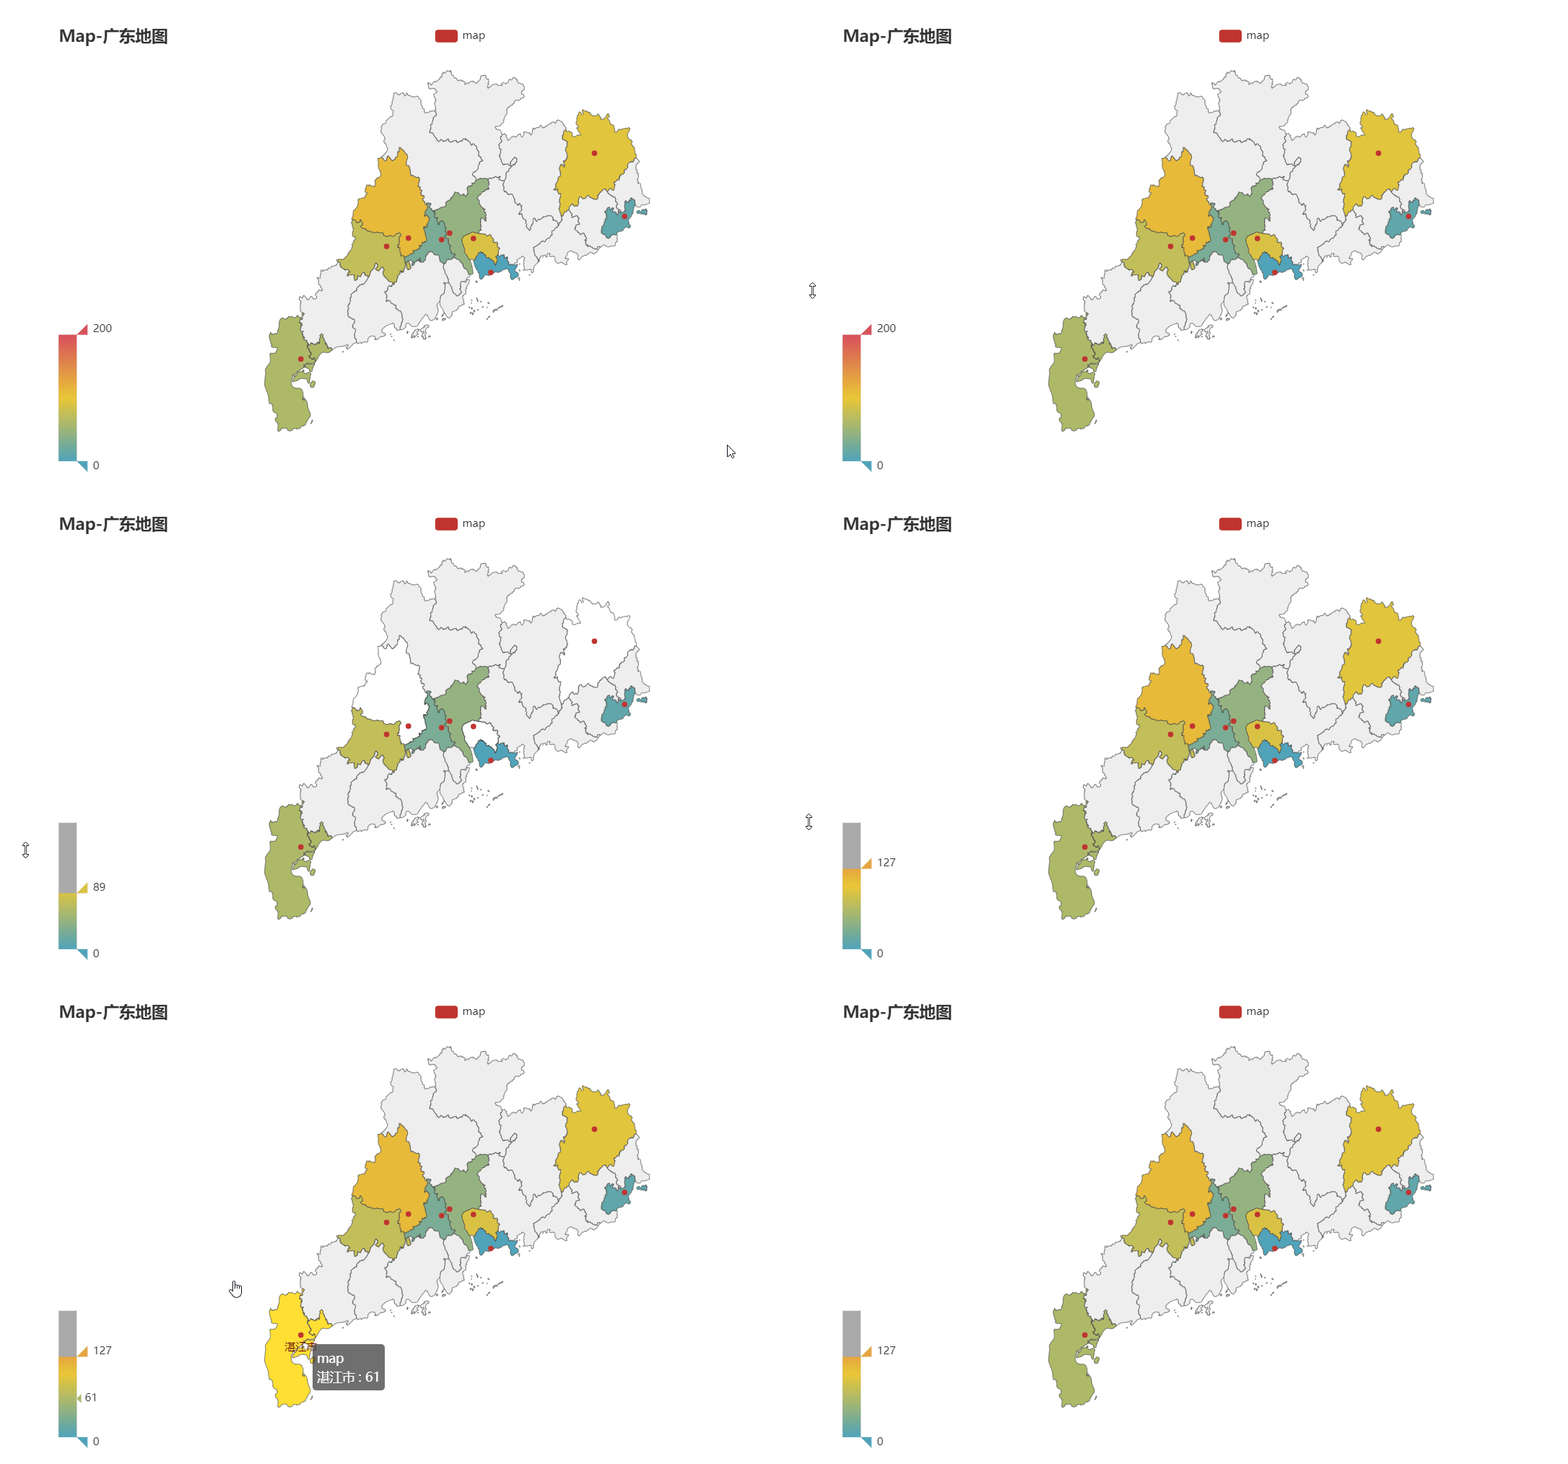
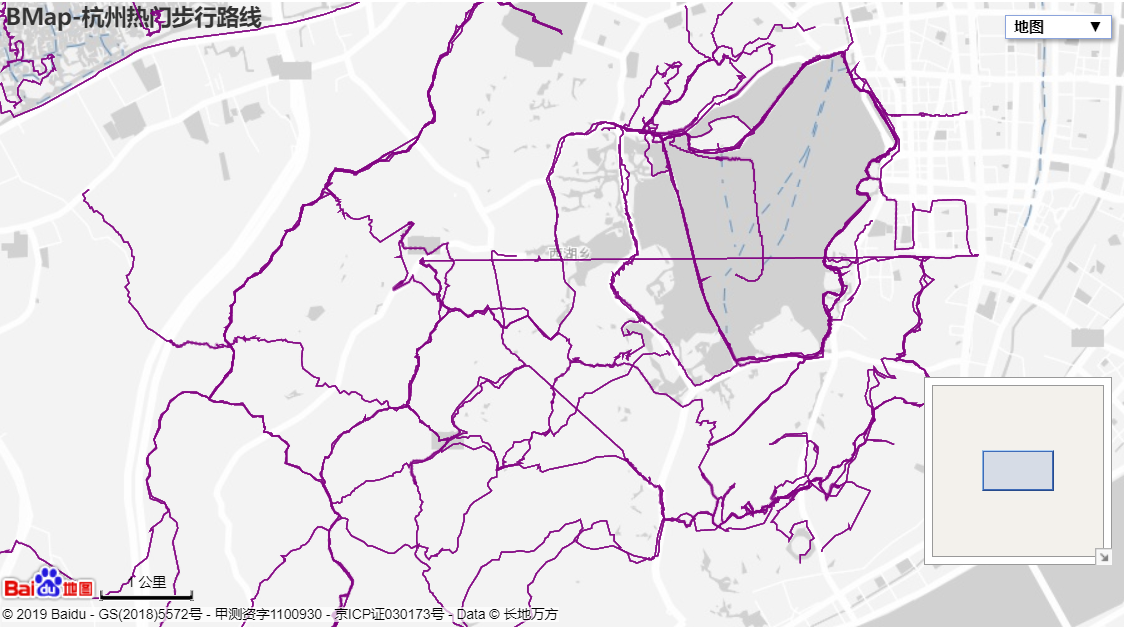
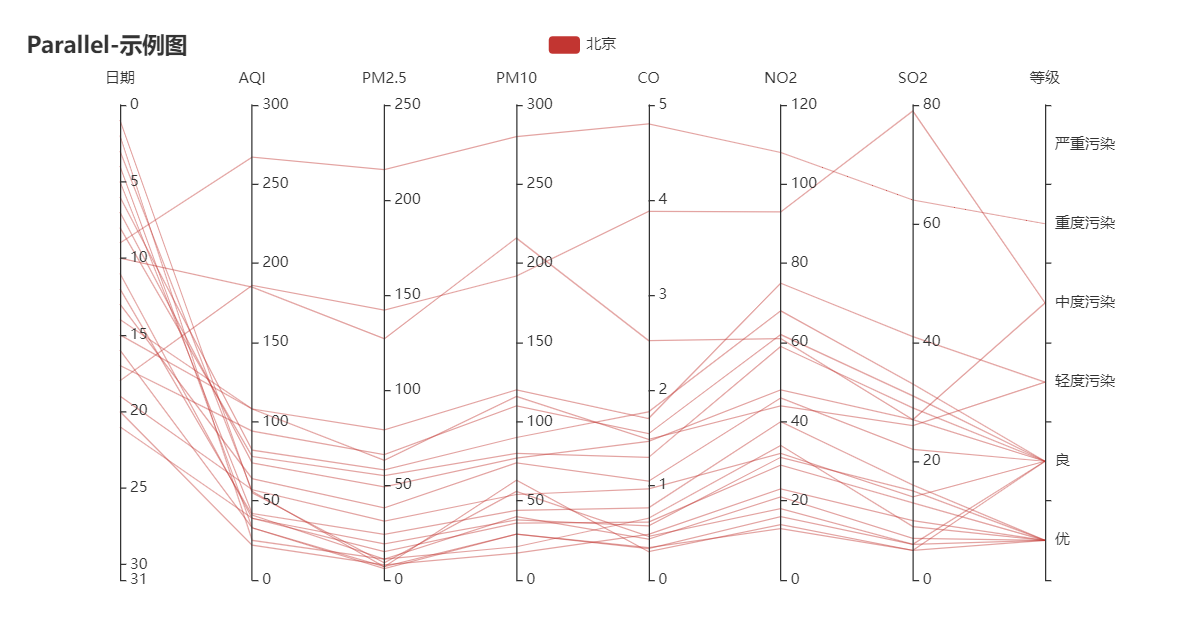
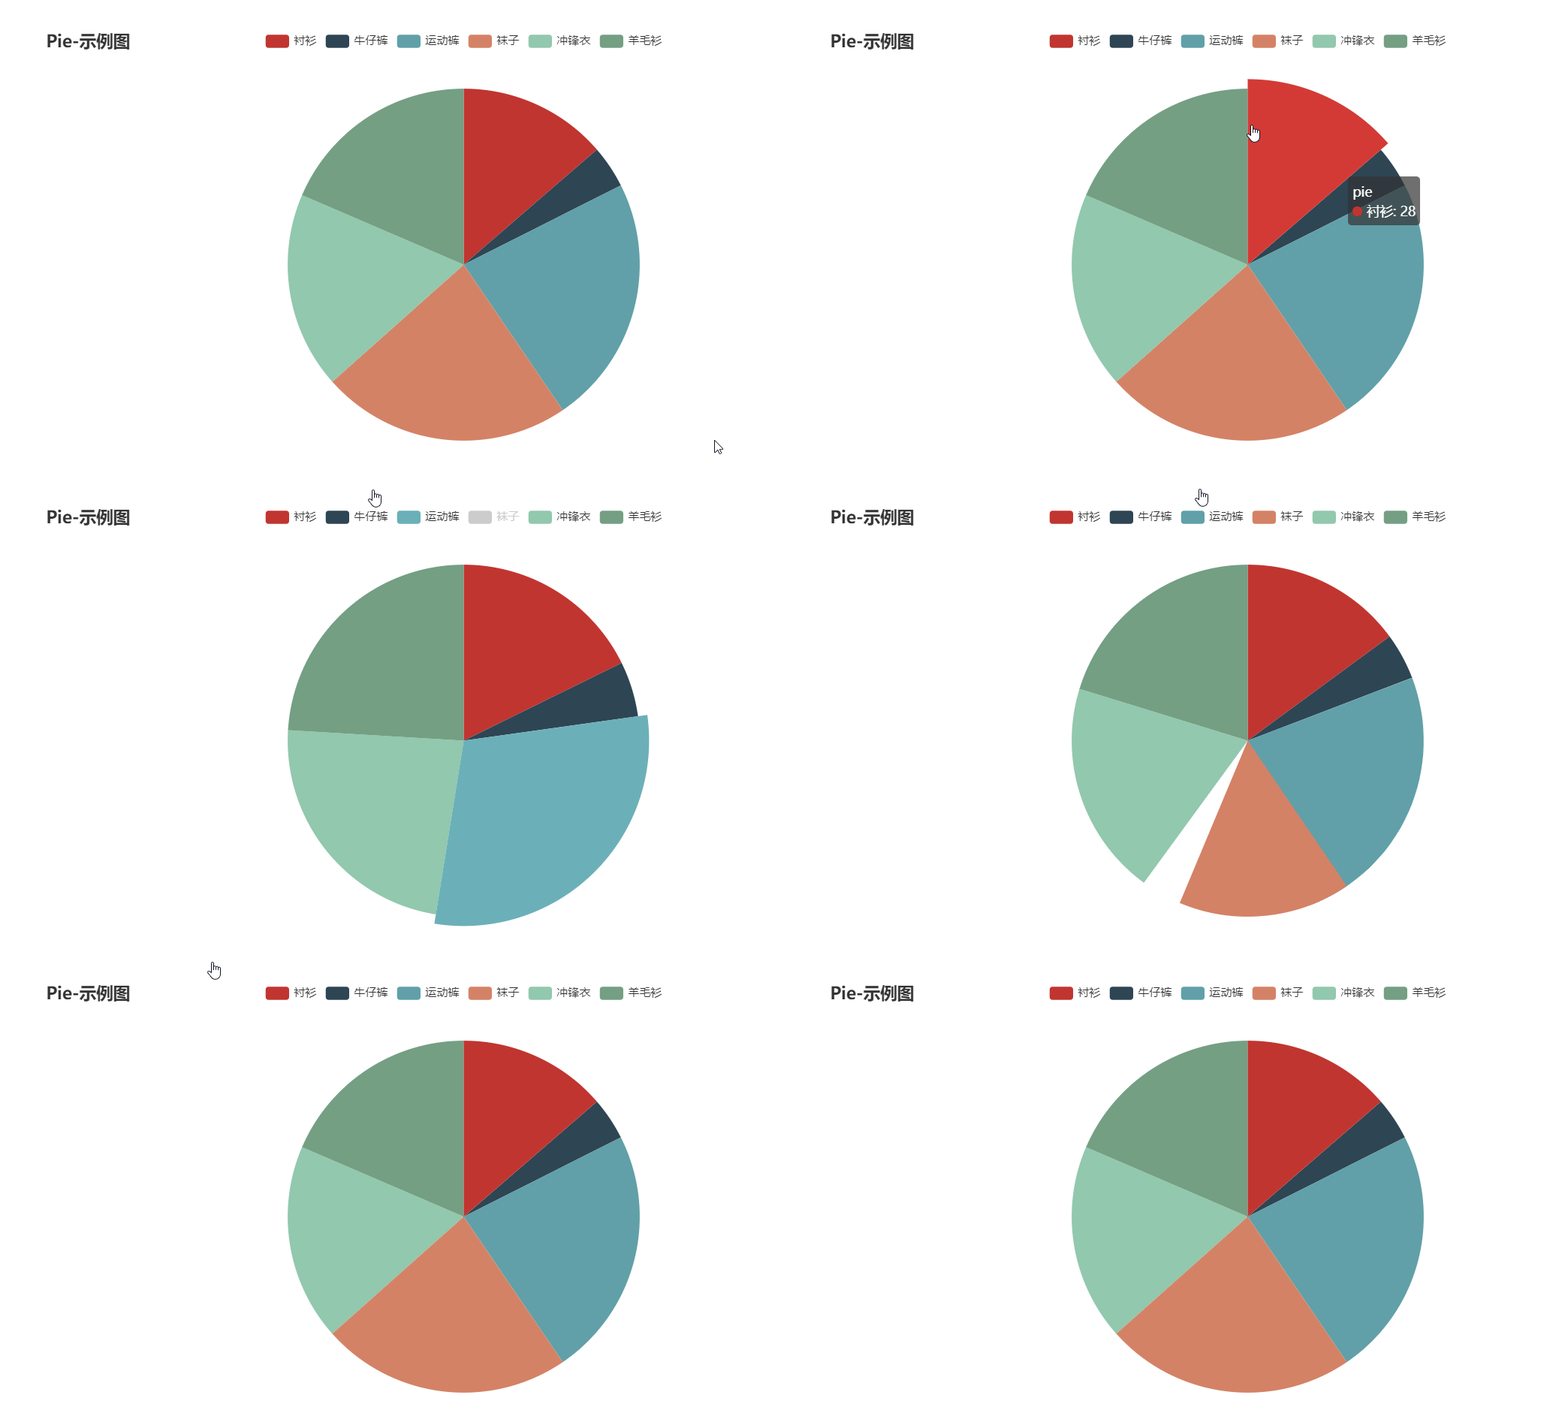
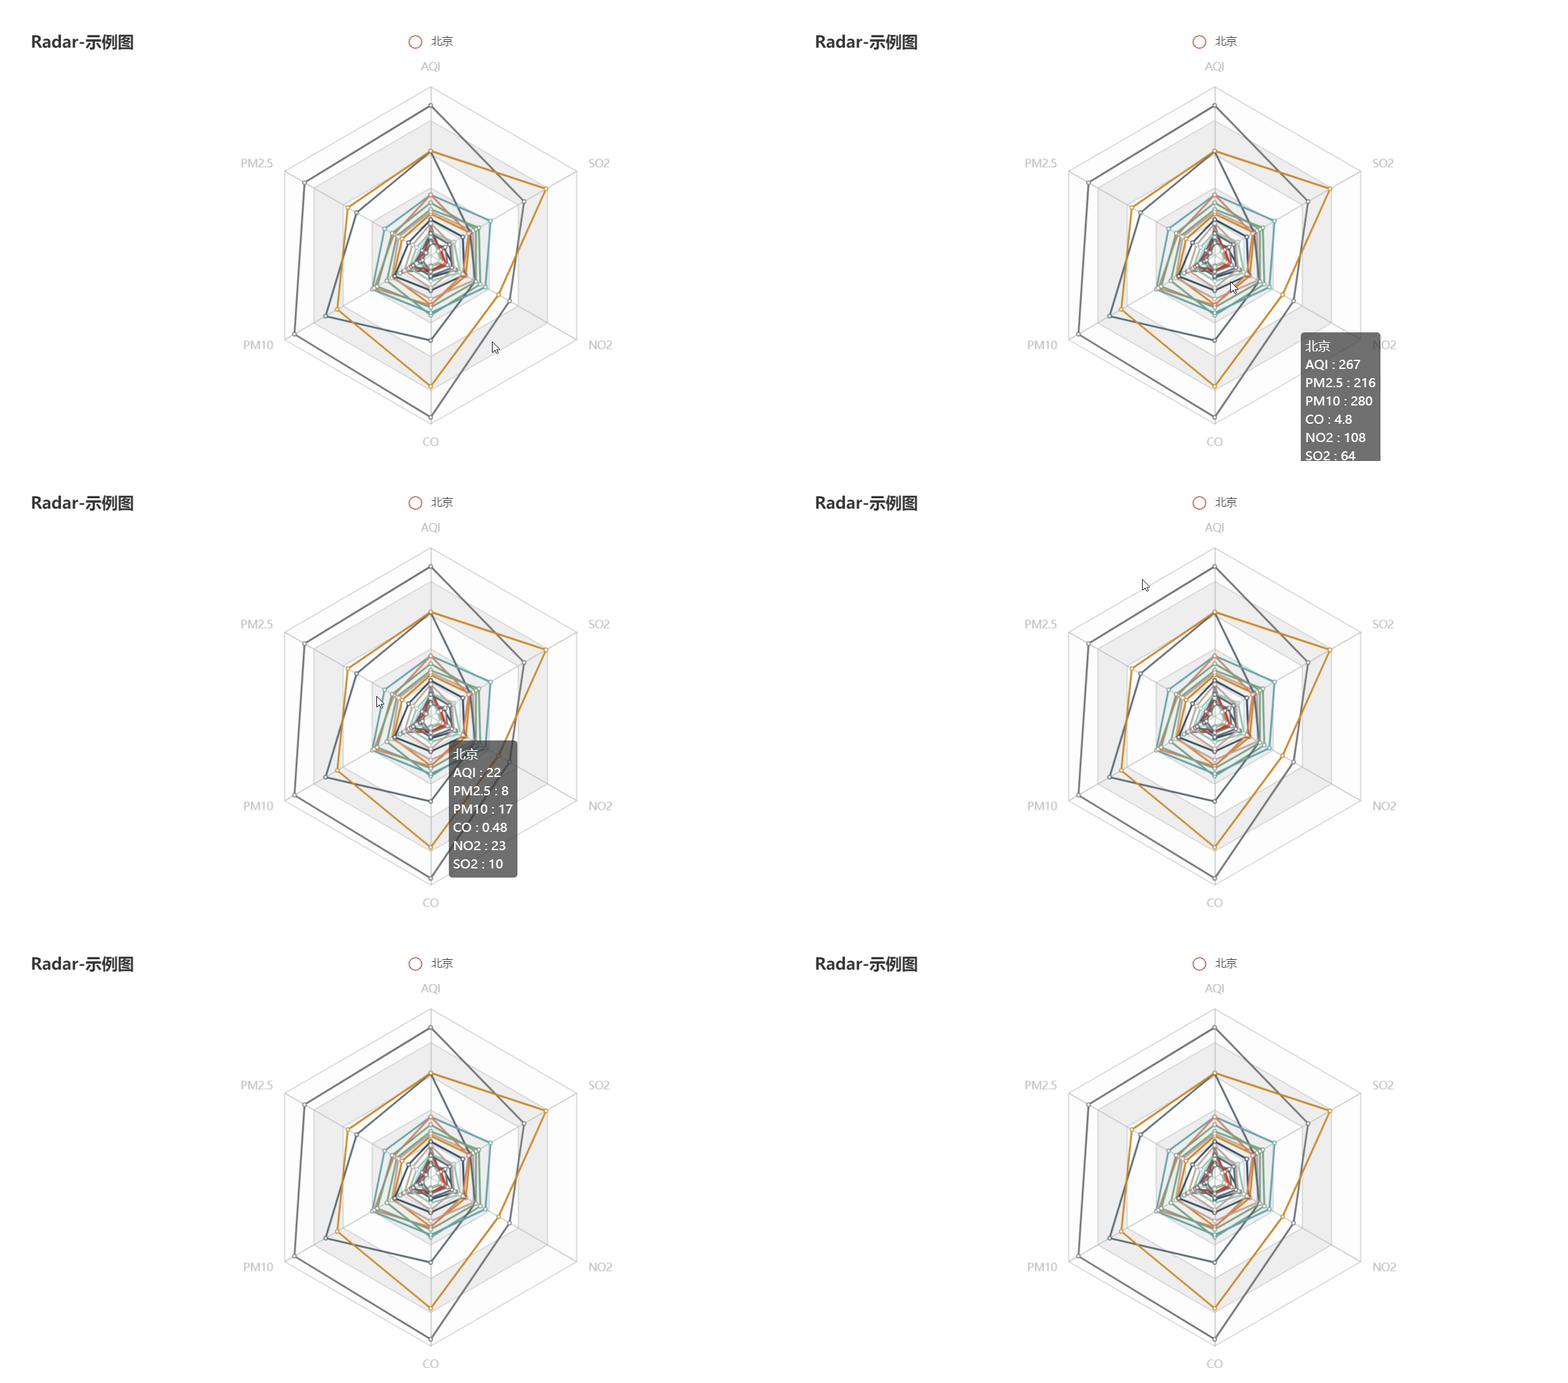
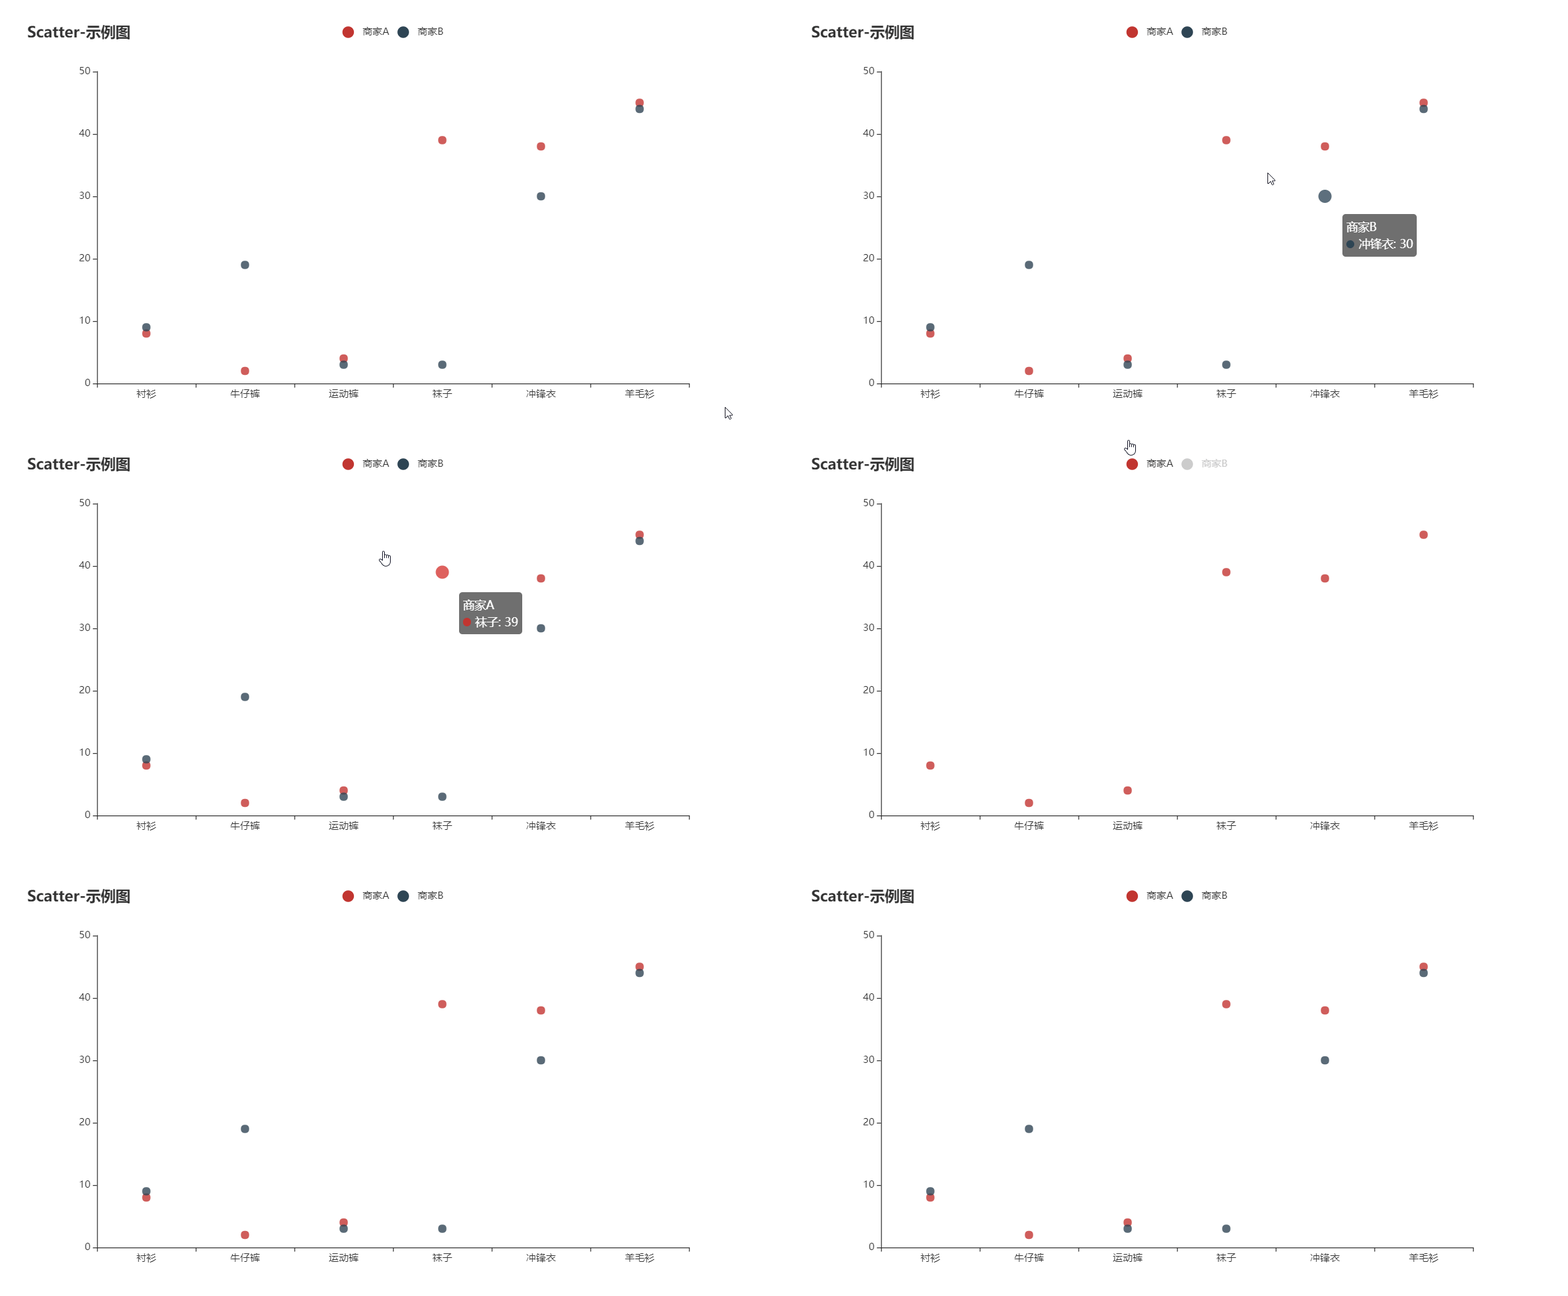
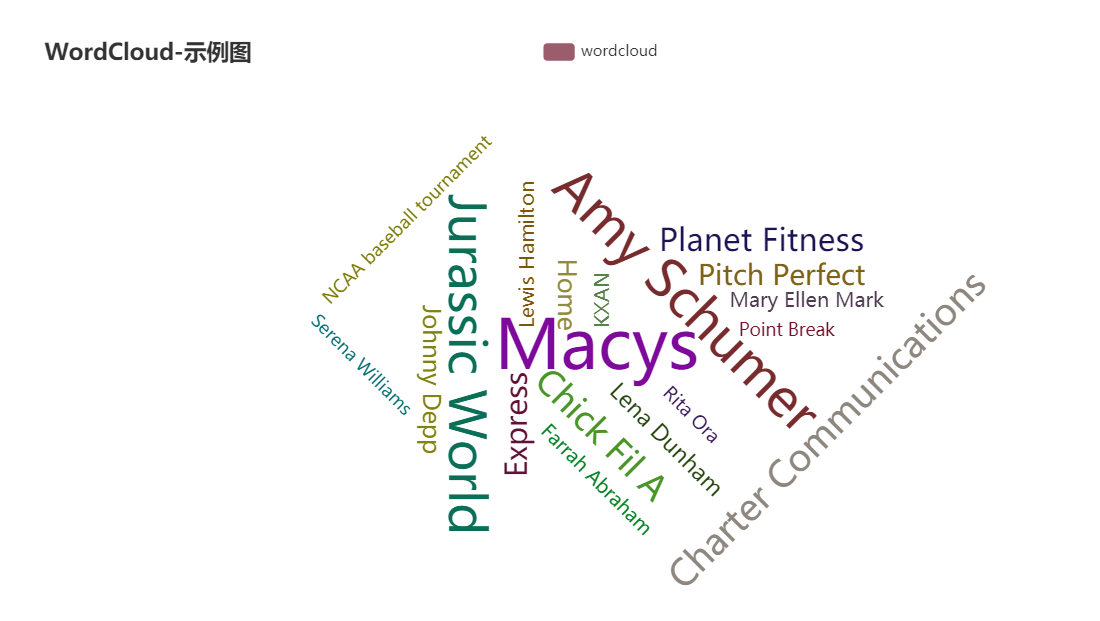
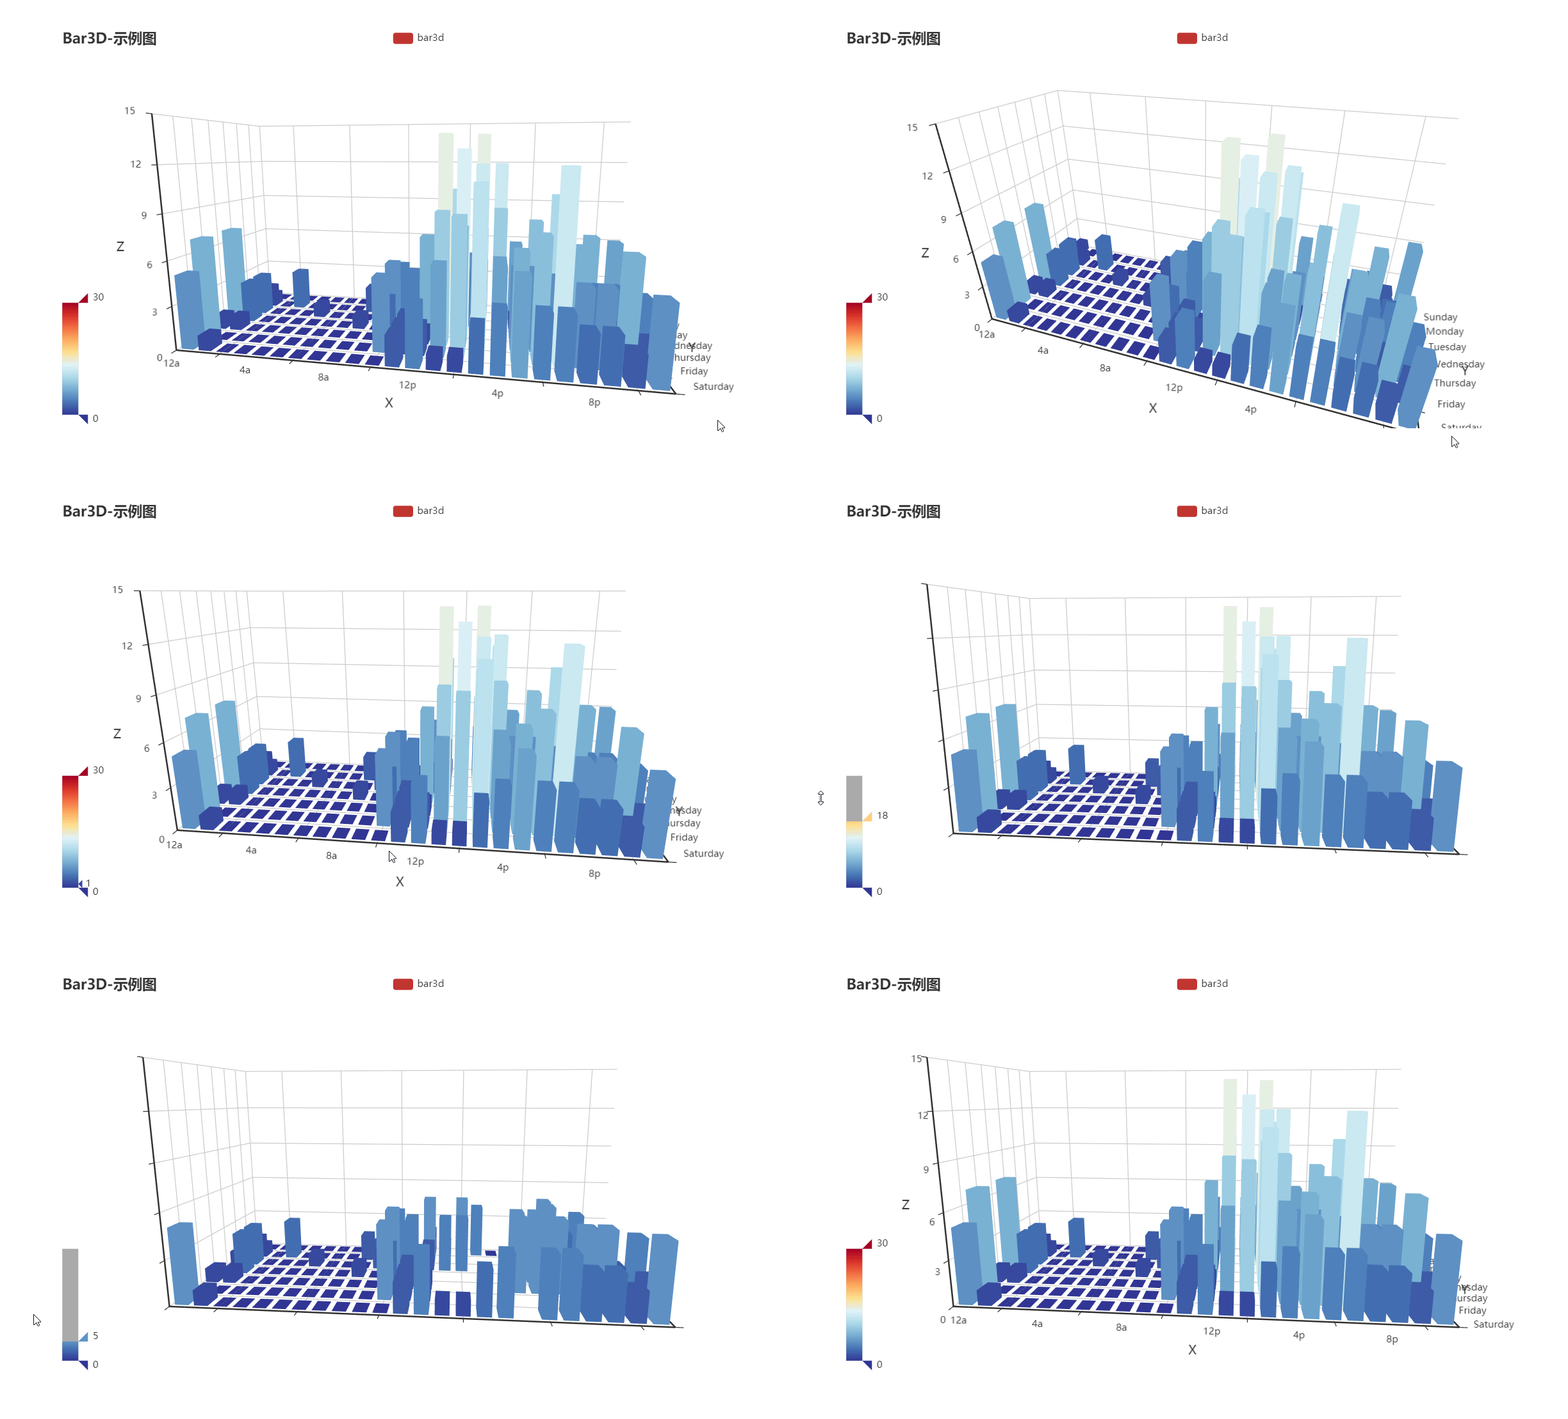
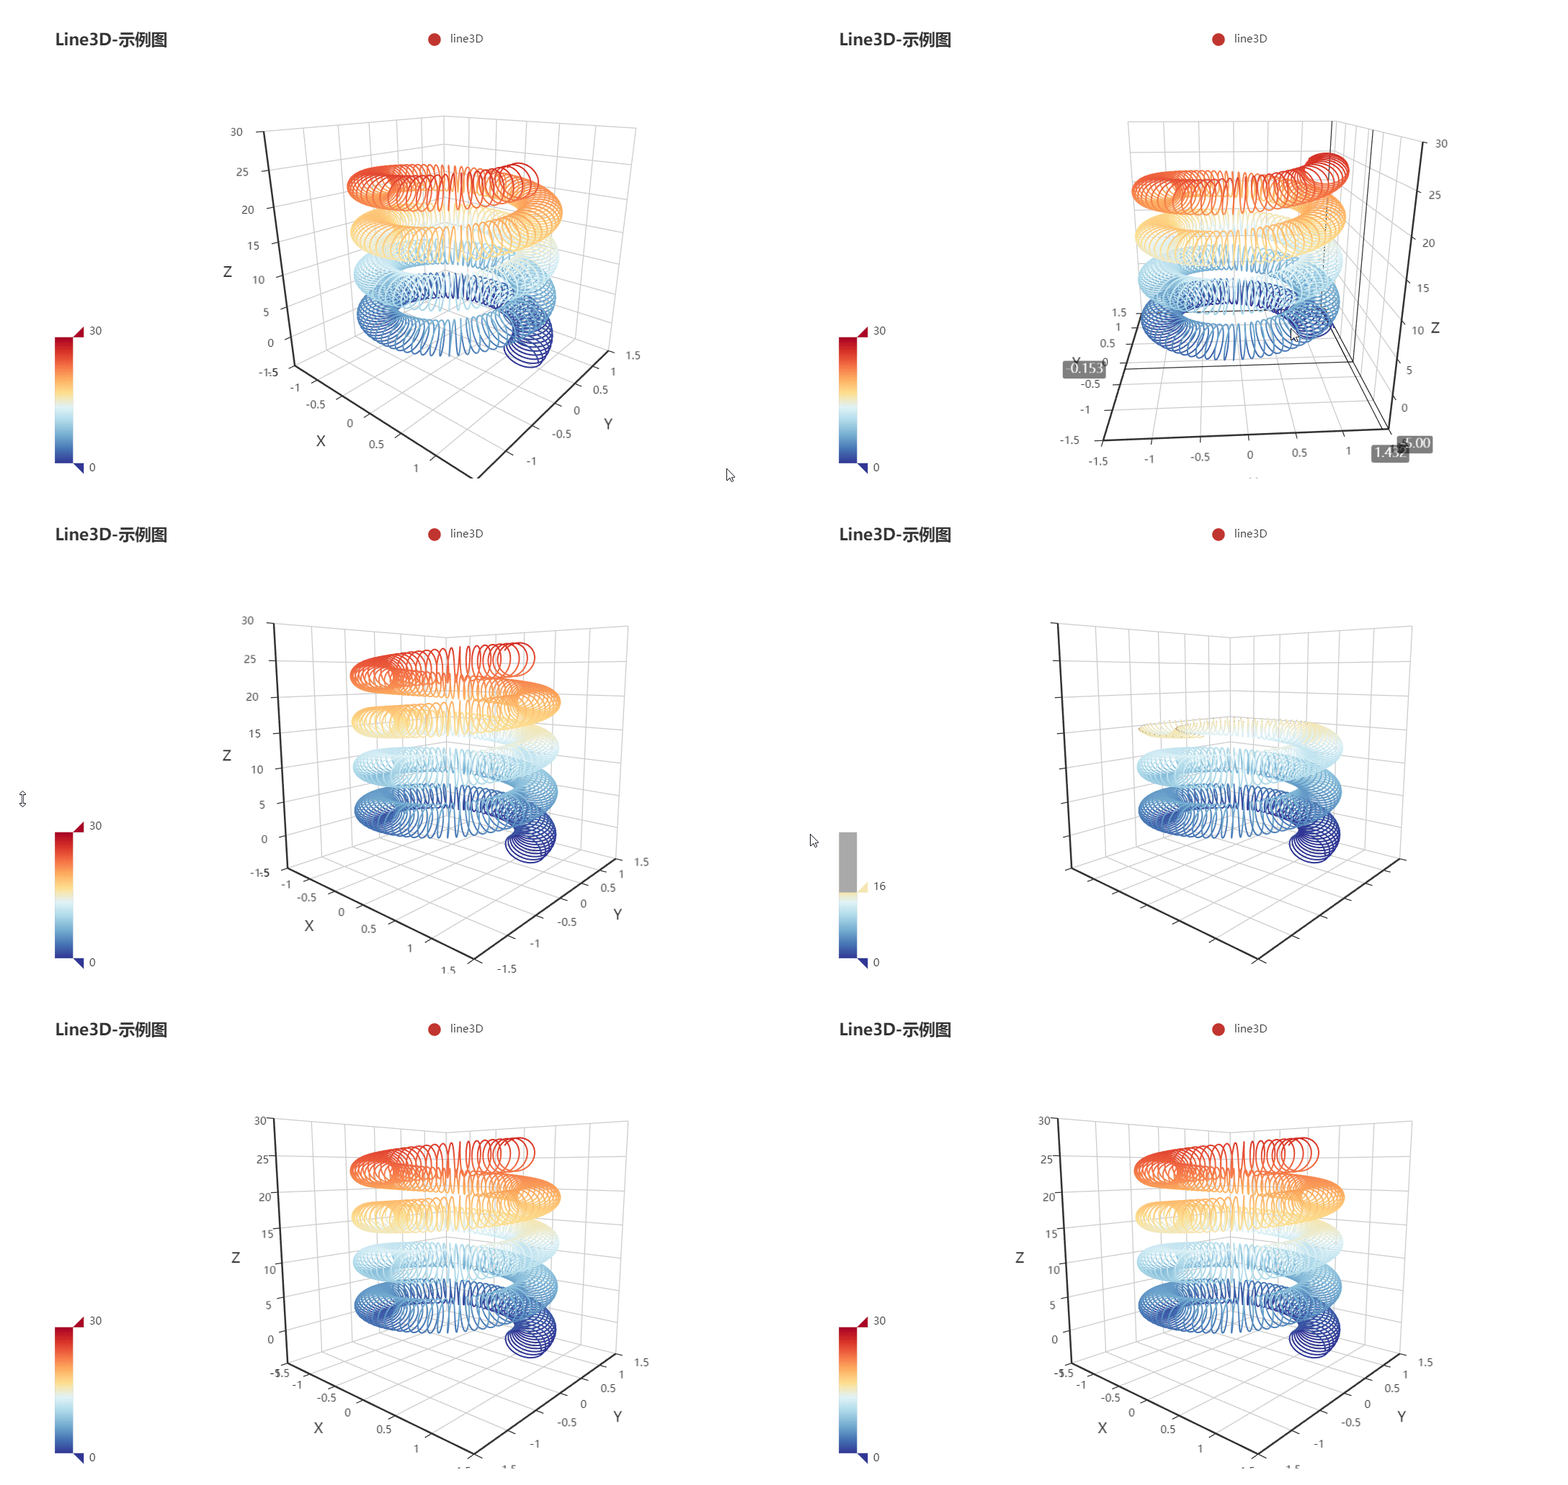
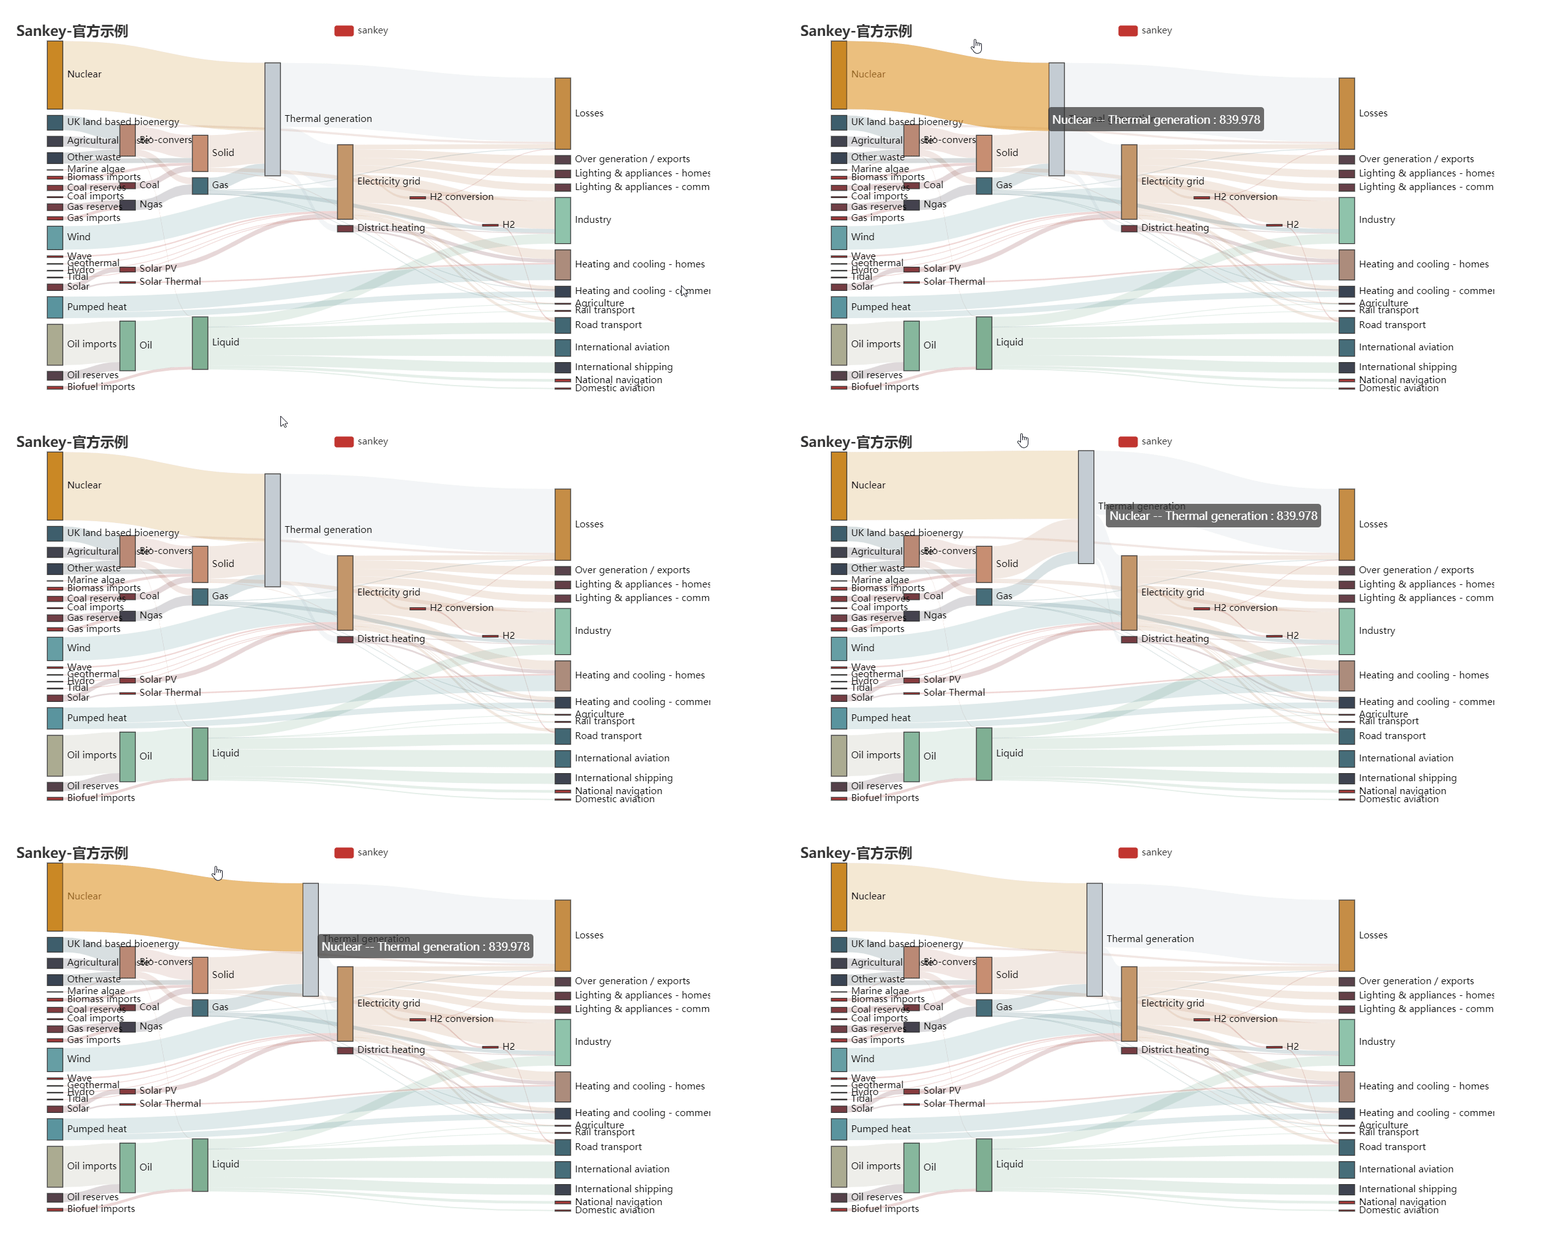
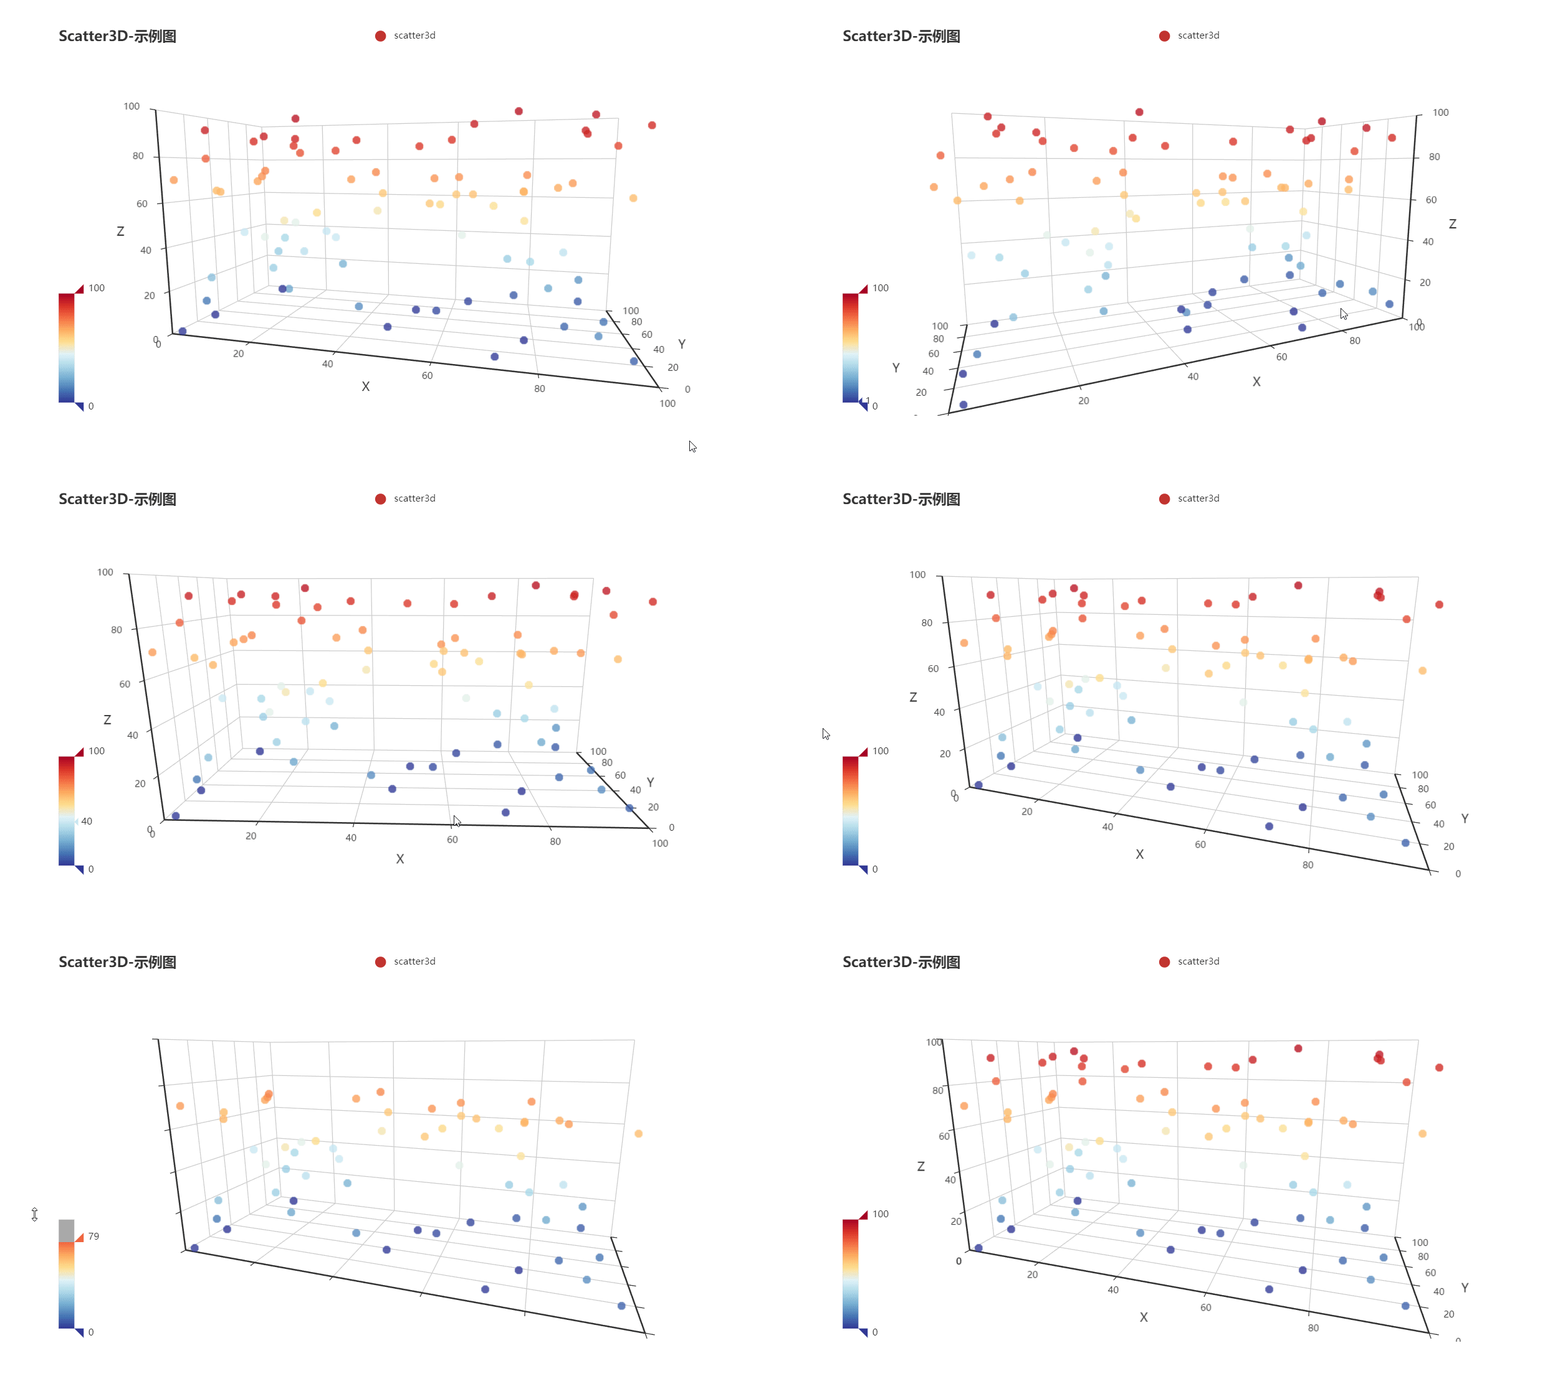
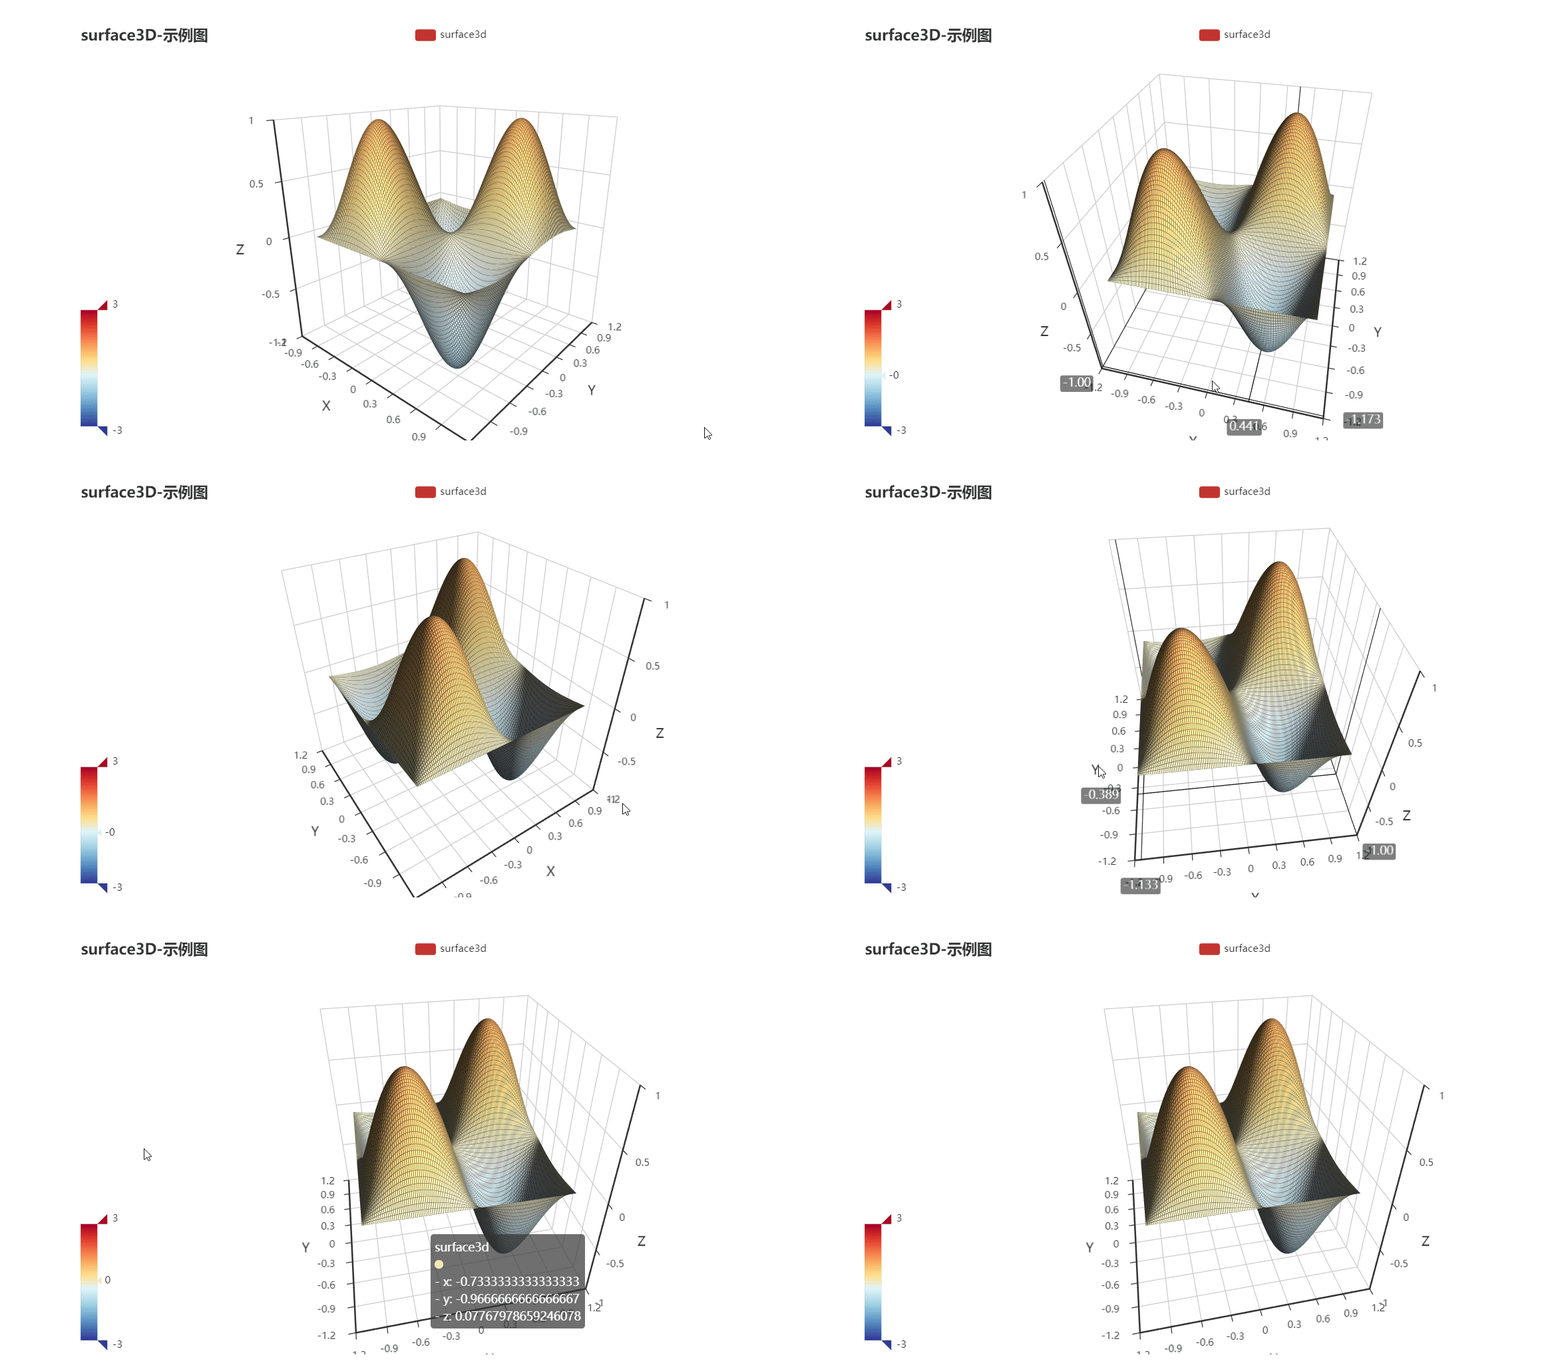
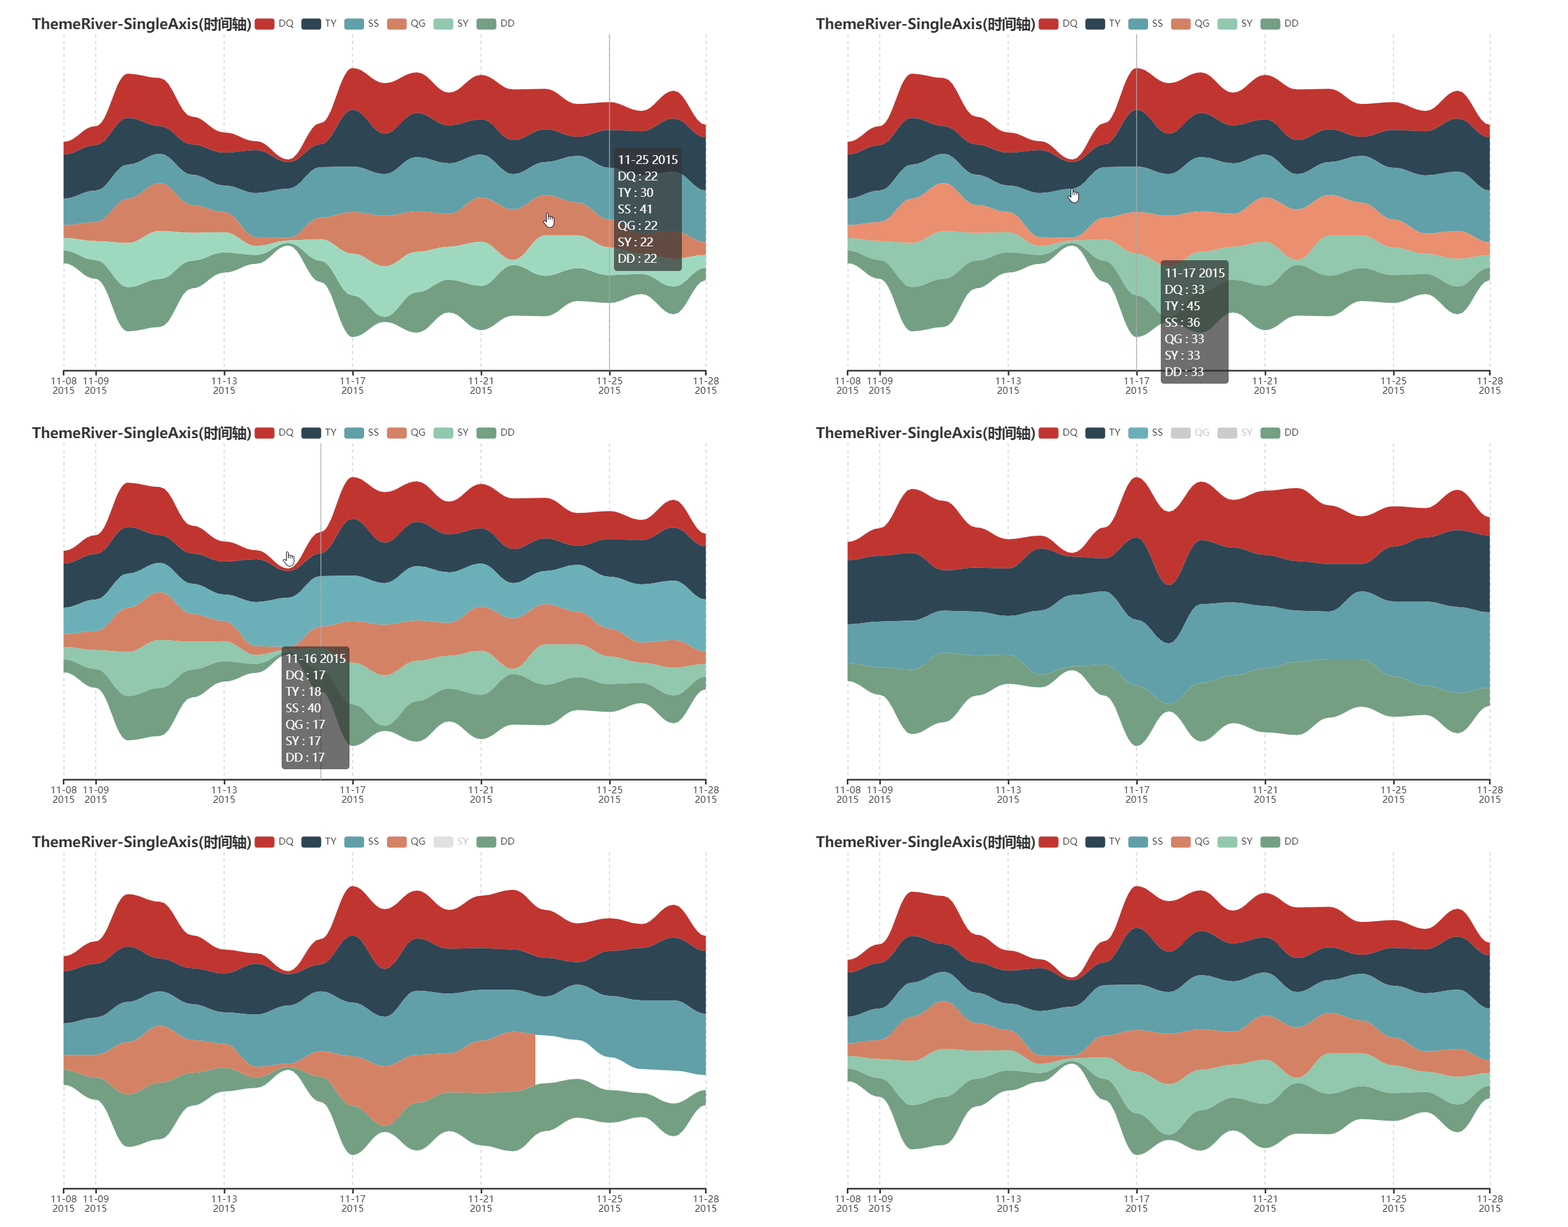
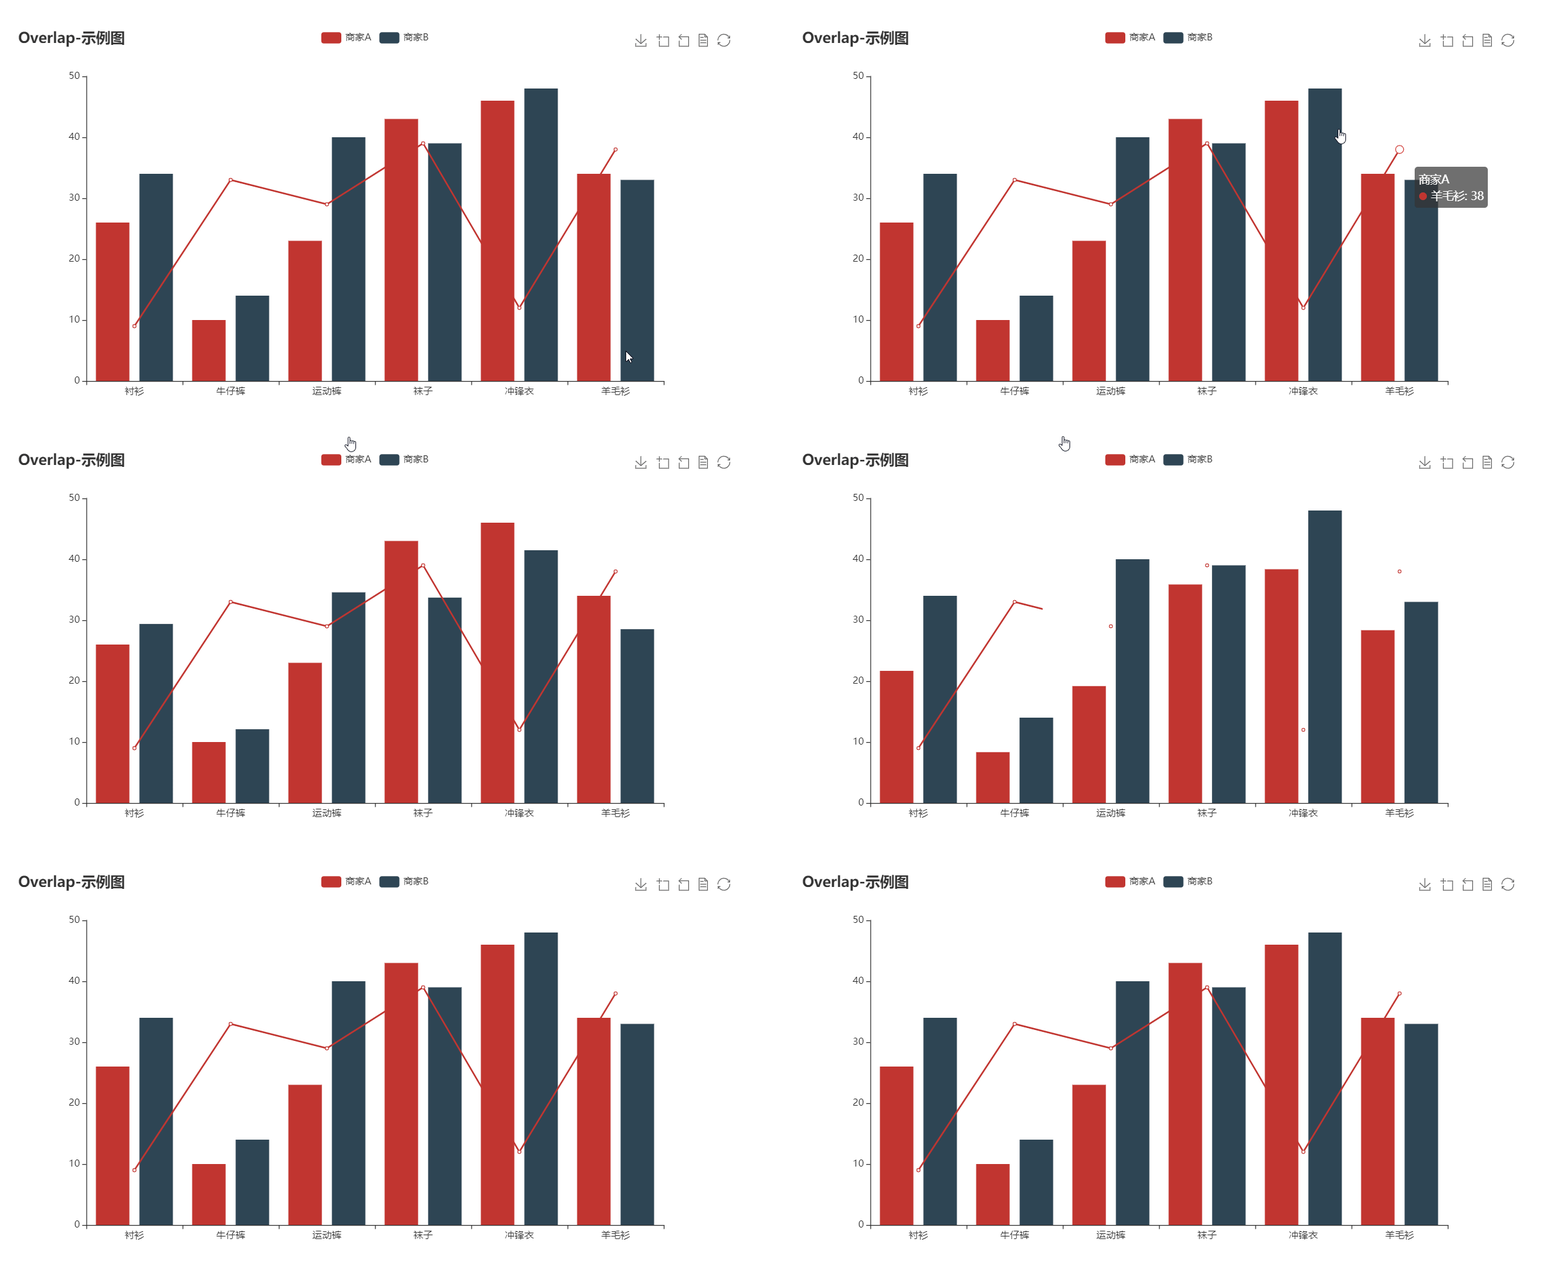
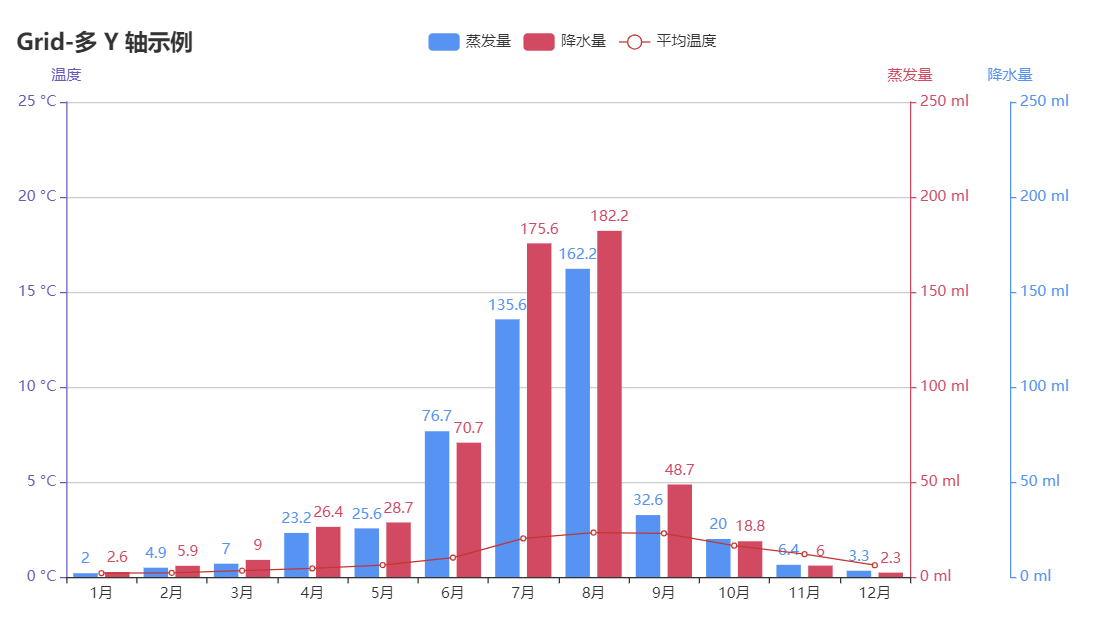
bar boxplot effectScatter funnel gague geo geo graph heatmap kline line liquid map bmap parallel pie ploar radar scatter tree treemap wordCloud bar3D line3D sankey scatter3D surface3D themeRiver sunburst overlap grid grid timeline

更多详细文档,请访问

代码质量

单元测试

$ pip install -r test/requirements.txt
$ make

集成测试

使用 Travis CIAppVeyor 持续集成环境。

代码规范

使用 flake8, Codecov 以及 pylint 提升代码质量。

😉 Author

pyecharts 主要由以下几位开发者开发维护

更多贡献者信息可以访问 pyecharts/graphs/contributors

💌 捐赠

开发和维护 pyecharts 花费了我巨大的心力,如果你觉得项目帮助到您,请认真考虑请作者喝一杯咖啡 😄

微信二维码 支付宝二维码
wechat-code alipay-code

如果其他开发者帮助到了您,也可以请他们喝咖啡 捐赠通道

💡 贡献

期待能有更多的开发者参与到 pyecharts 的开发中来,我们会保证尽快 Reivew PR 并且及时回复。但提交 PR 请确保

  1. 通过所有单元测试,如若是新功能,请为其新增单元测试
  2. 遵守开发规范,使用 black 以及 isort 格式化代码($ pip install -r requirements-dev.txt)
  3. 如若需要,请更新相对应的文档

我们也非常欢迎开发者能为 pyecharts 提供更多的示例,共同来完善文档,文档项目位于 pyecharts/website

📃 License

MIT ©chenjiandongx

Owner
pyecharts
pyecharts dev team
pyecharts
Chem: collection of mostly python code for molecular visualization, QM/MM, FEP, etc

chem: collection of mostly python code for molecular visualization, QM/MM, FEP,

5 Sep 02, 2022
Bcc2telegraf: An integration that sends ebpf-based bcc histogram metrics to telegraf daemon

bcc2telegraf bcc2telegraf is an integration that sends ebpf-based bcc histogram

Peter Bobrov 2 Feb 17, 2022
Political elections, appointment, analysis and visualization in Python

Political elections, appointment, analysis and visualization in Python poli-sci-kit is a Python package for political science appointment and election

Andrew Tavis McAllister 9 Dec 01, 2022
Fast 1D and 2D histogram functions in Python

About Sometimes you just want to compute simple 1D or 2D histograms with regular bins. Fast. No nonsense. Numpy's histogram functions are versatile, a

Thomas Robitaille 237 Dec 18, 2022
A central task in drug discovery is searching, screening, and organizing large chemical databases

A central task in drug discovery is searching, screening, and organizing large chemical databases. Here, we implement clustering on molecular similarity. We support multiple methods to provide a inte

NVIDIA Corporation 124 Jan 07, 2023
Rockstar - Makes you a Rockstar C++ Programmer in 2 minutes

Rockstar Rockstar is one amazing library, which will make you a Rockstar Programmer in just 2 minutes. In last decade, people learned C++ in 21 days.

4k Jan 05, 2023
Data Visualizations for the #30DayChartChallenge

The #30DayChartChallenge This repository contains all the charts made for the #30DayChartChallenge during the month of April. This project aims to exp

Isaac Arroyo 7 Sep 20, 2022
Data aggregated from the reports found at the MCPS COVID Dashboard into a set of visualizations.

Montgomery County Public Schools COVID-19 Visualizer Contents About this project Data Support this project About this project Data All data we use can

James 3 Jan 19, 2022
erdantic is a simple tool for drawing entity relationship diagrams (ERDs) for Python data model classes

erdantic is a simple tool for drawing entity relationship diagrams (ERDs) for Python data model classes. Diagrams are rendered using the venerable Graphviz library.

DrivenData 129 Jan 04, 2023
script to generate HeN ipfs app exports of GLSL shaders

HeNerator A simple script to generate HeN ipfs app exports from any frag shader created with: GlslViewer GlslEditor The Book of Shaders glslCanvas VS

Patricio Gonzalez Vivo 22 Dec 21, 2022
Flexitext is a Python library that makes it easier to draw text with multiple styles in Matplotlib

Flexitext is a Python library that makes it easier to draw text with multiple styles in Matplotlib

Tomás Capretto 93 Dec 28, 2022
Gallery of applications built using bqplot and widget libraries like ipywidgets, ipydatagrid etc.

bqplot Gallery This is a gallery of bqplot examples. View the gallery at https://bqplot.github.io/bqplot-gallery. Contributing new examples Clone this

8 Aug 23, 2022
100 data puzzles for pandas, ranging from short and simple to super tricky (60% complete)

100 pandas puzzles Puzzles notebook Solutions notebook Inspired by 100 Numpy exerises, here are 100* short puzzles for testing your knowledge of panda

Alex Riley 1.9k Jan 08, 2023
Plot and save the ground truth and predicted results of human 3.6 M and CMU mocap dataset.

Visualization-of-Human3.6M-Dataset Plot and save the ground truth and predicted results of human 3.6 M and CMU mocap dataset. human-motion-prediction

Gaurav Kumar Yadav 5 Nov 18, 2022
Pyan3 - Offline call graph generator for Python 3

Pyan takes one or more Python source files, performs a (rather superficial) static analysis, and constructs a directed graph of the objects in the combined source, and how they define or use each oth

Juha Jeronen 235 Jan 02, 2023
Simple and lightweight Spotify Overlay written in Python.

Simple Spotify Overlay This is a simple yet powerful Spotify Overlay. About I have been looking for something like this ever since I got Spotify. I th

27 Sep 03, 2022
Analytical Web Apps for Python, R, Julia, and Jupyter. No JavaScript Required.

Dash Dash is the most downloaded, trusted Python framework for building ML & data science web apps. Built on top of Plotly.js, React and Flask, Dash t

Plotly 17.9k Dec 31, 2022
Package managers visualization

Software Galaxies This repository combines visualizations of major software package managers. All visualizations are available here: http://anvaka.git

Andrei Kashcha 1.4k Dec 22, 2022
a python function to plot a geopandas dataframe

Pretty GeoDataFrame A minimum python function (~60 lines) to draw pretty geodataframe. Based on matplotlib, shapely, descartes. Installation just use

haoming 27 Dec 05, 2022
A customized interface for single cell track visualisation based on pcnaDeep and napari.

pcnaDeep-napari A customized interface for single cell track visualisation based on pcnaDeep and napari. 👀 Under construction You can get test image

ChanLab 2 Nov 07, 2021