Create 3d loss surface visualizations, with optimizer path. Issues welcome!

Overview

MLVTK PyPI - Python Version PyPI

A loss surface visualization tool

Png

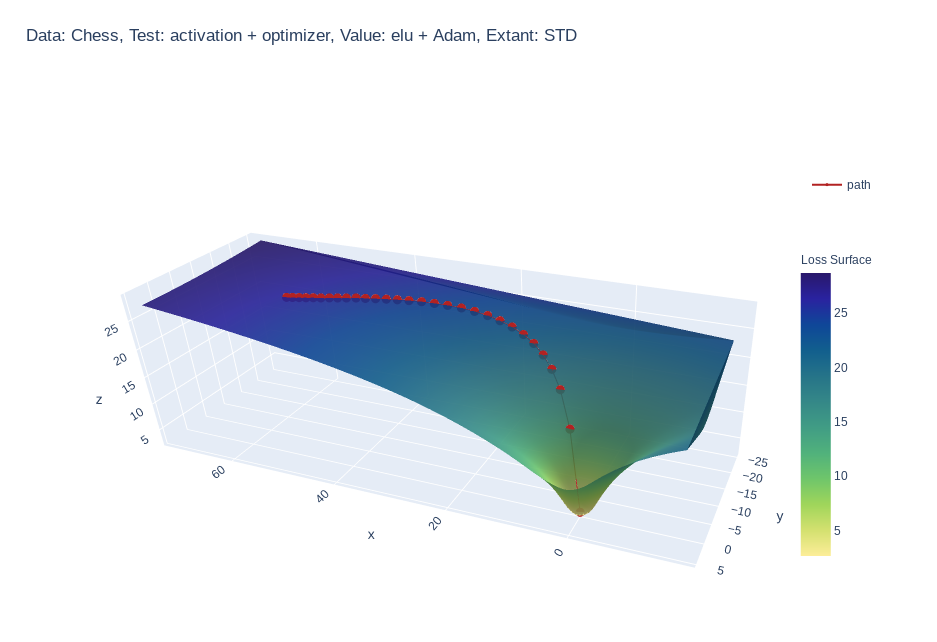
Simple feed-forward network trained on chess data, using elu activation and Adam optimizer


Gif

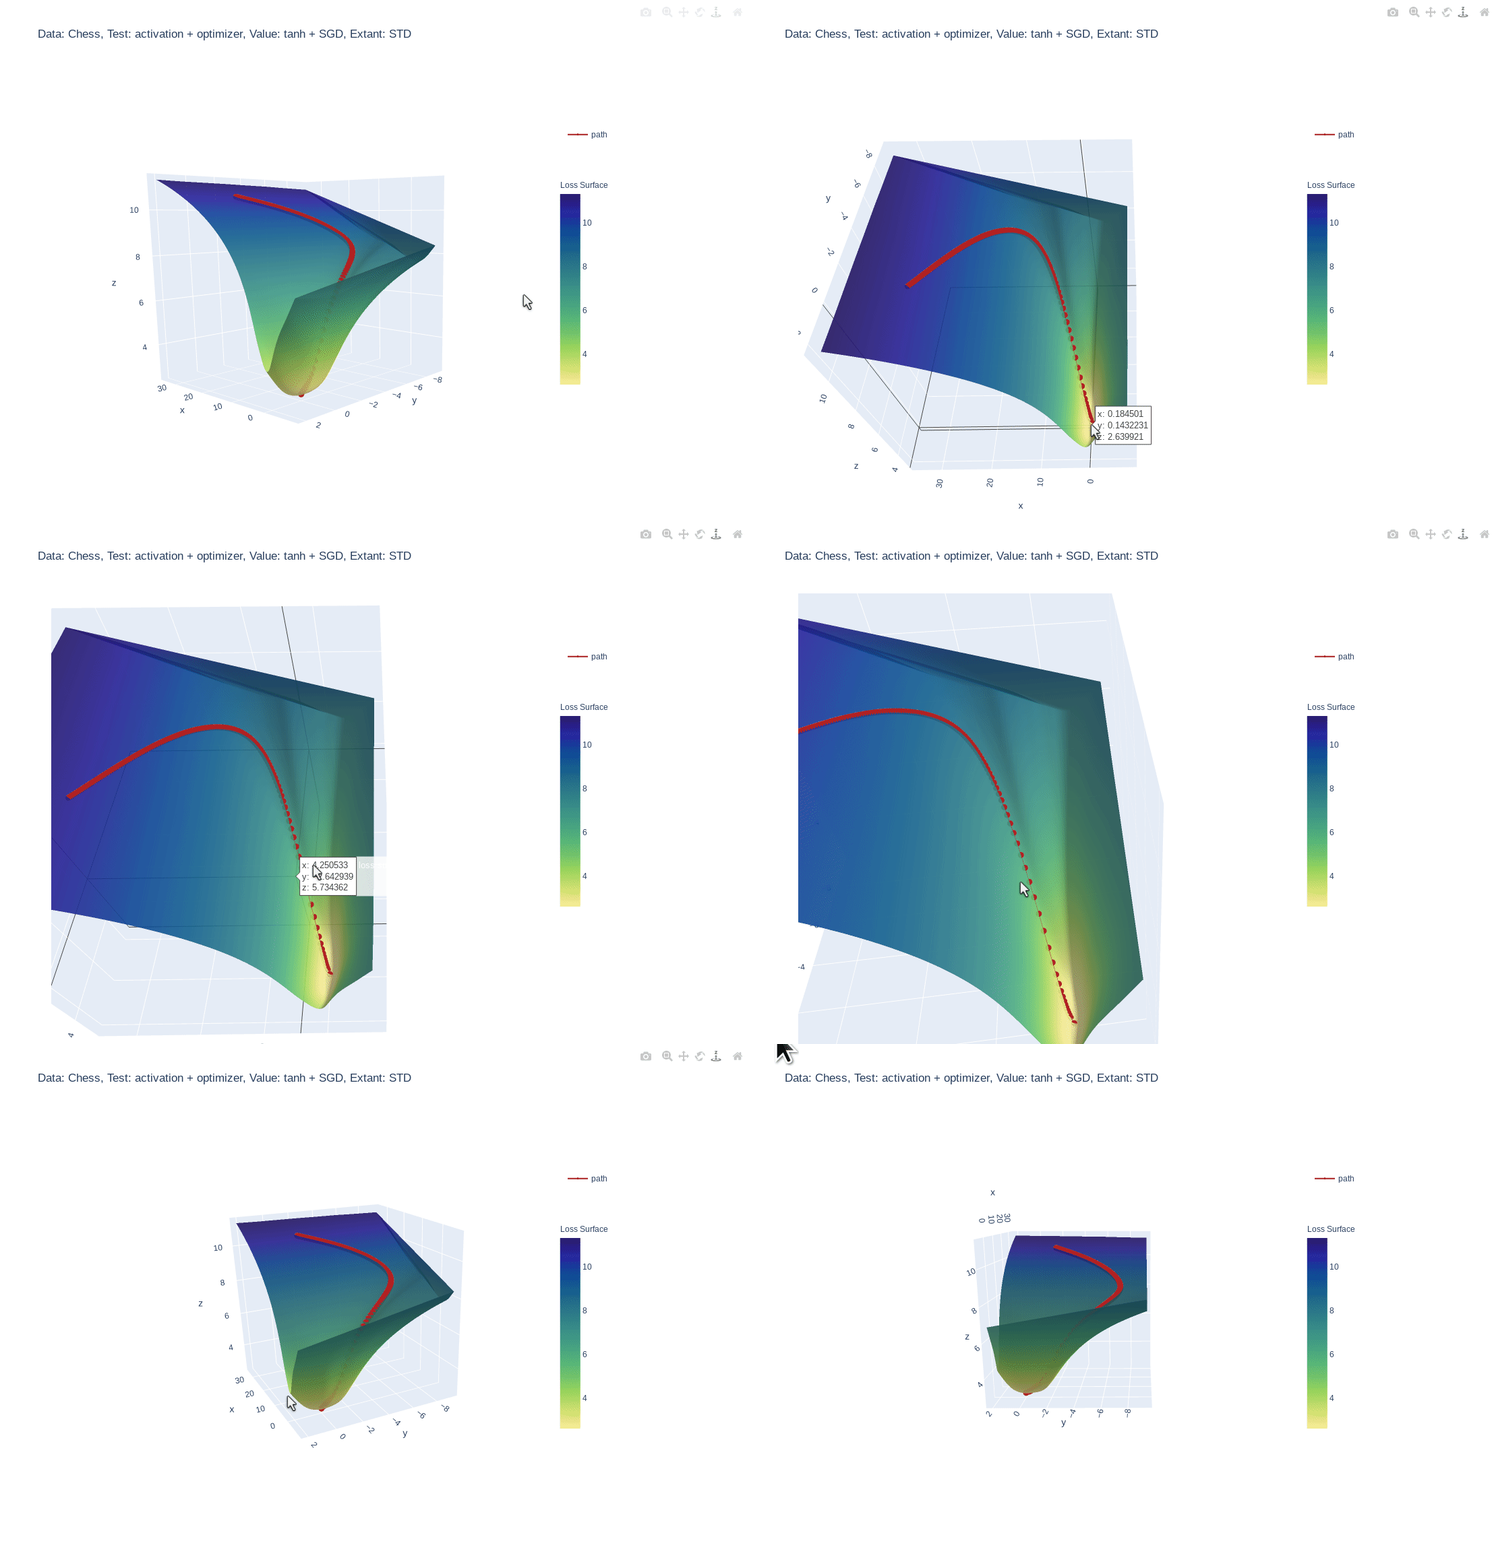
Simple feed-forward network trained on chess data, using tanh activation and SGD optimizer


Gif

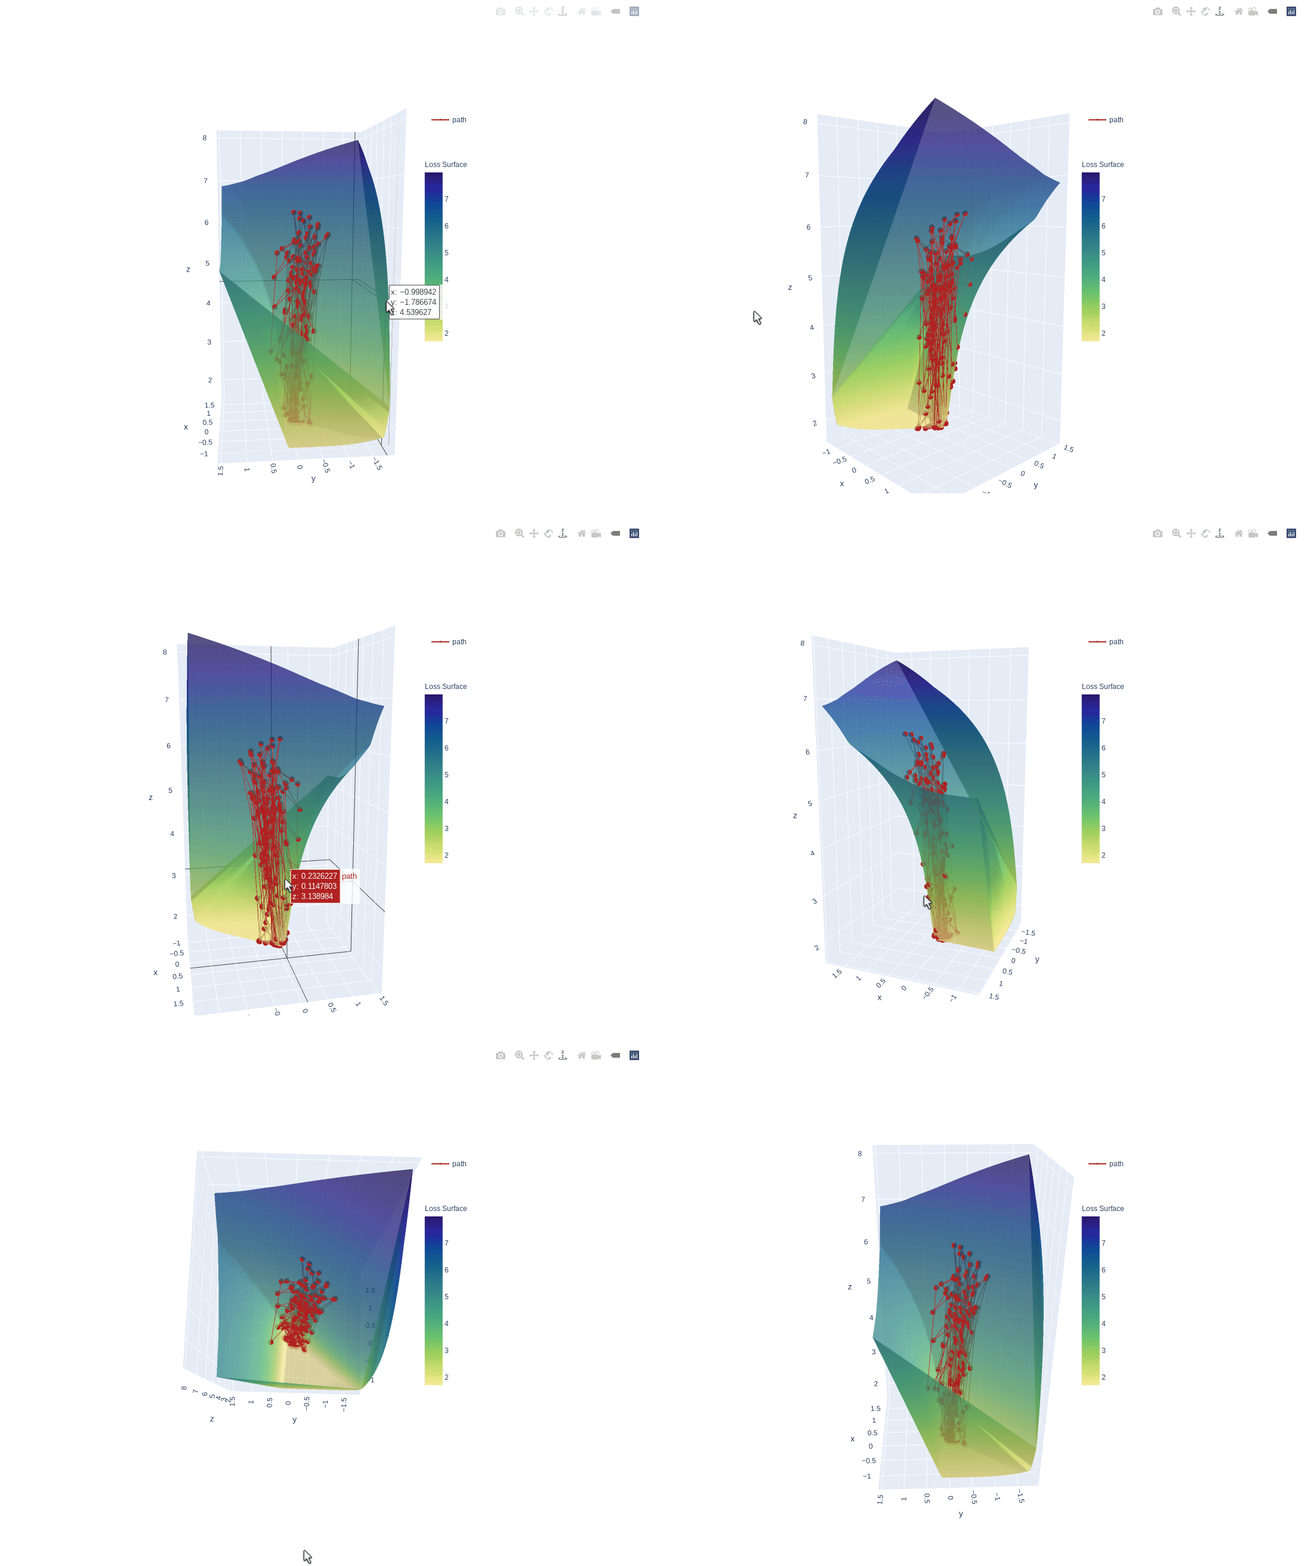
3 layer feed-forward network trained on hand written letters data, using relu activation, SGD optimizer and learning rate of 2.0. Example of what happens to path when learning rate is too high


Gif

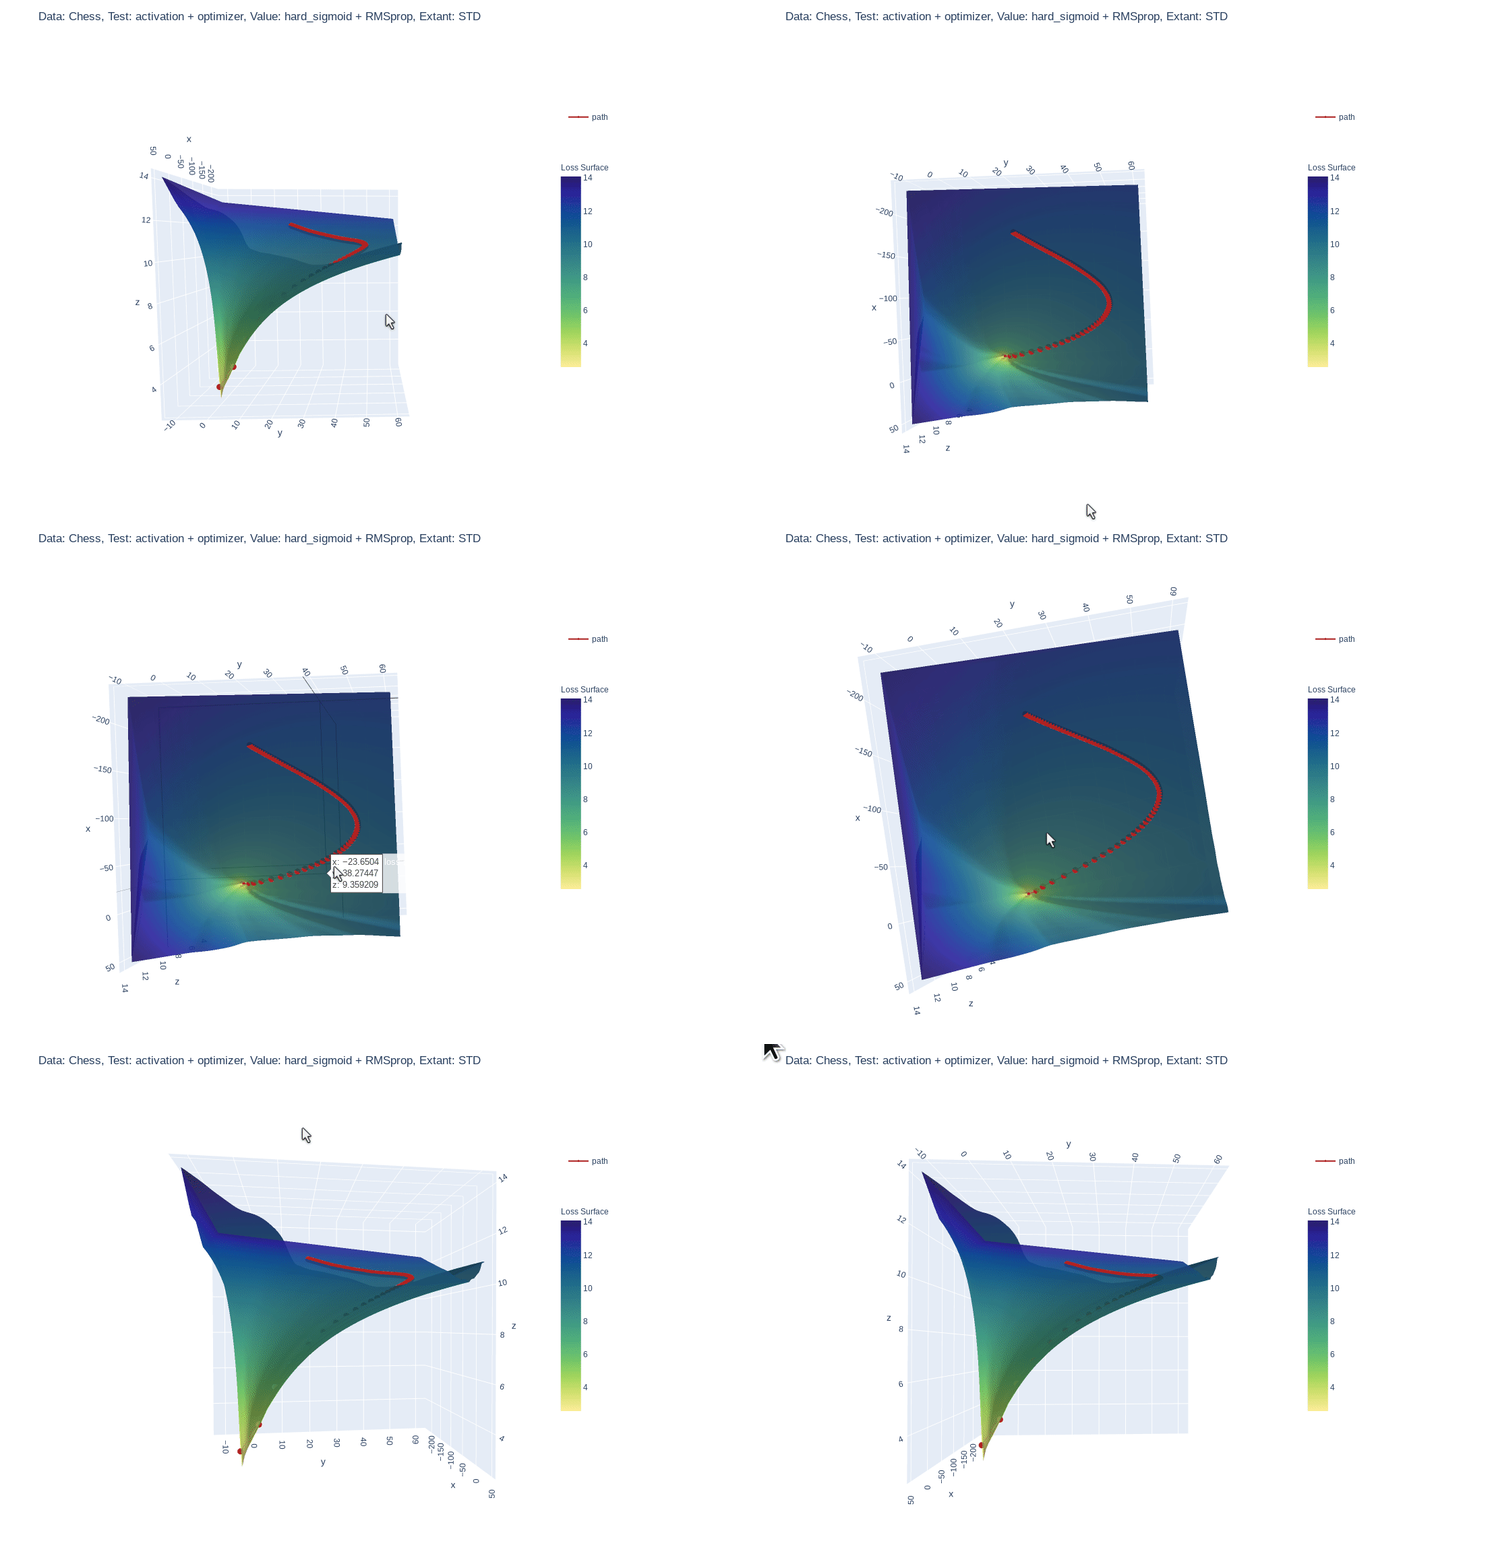
Simple feed-forward network trained on chess data, using hard-sigmoid activation and RMSprop optimizer

Why?

  • :shipit: Simple: A single line addition is all that is needed.
  • Informative: Gain insight into what your model is seeing.
  • 📓 Educational: See how your hyper parameters and architecture impact your models perception.

Quick Start

Requires version
python >= 3.6.1
tensorflow >= 2.3.1
plotly >=4.9.0

Install locally (Also works in google Colab!):

pip install mlvtk

Optionally for use with jupyter notebook/lab:

Notebook

=5.3" "ipywidgets==7.5"">
pip install "notebook>=5.3" "ipywidgets==7.5"

Lab

pip install jupyterlab "ipywidgets==7.5"

# Basic JupyterLab renderer support
jupyter labextension install [email protected]

# OPTIONAL: Jupyter widgets extension for FigureWidget support
jupyter labextension install @jupyter-widgets/jupyterlab-manager [email protected]

Basic Example

from mlvtk.base import Vmodel
import tensorflow as tf
import numpy as np

# NN with 1 hidden layer
inputs = tf.keras.layers.Input(shape=(None,100))
dense_1 = tf.keras.layers.Dense(50, activation='relu')(inputs)
outputs = tf.keras.layers.Dense(10, activation='softmax')(dense_1)
_model = tf.keras.Model(inputs, outputs)

# Wrap with Vmodel
model = Vmodel(_model)
model.compile(optimizer=tf.keras.optimizers.SGD(),
loss=tf.keras.losses.CategoricalCrossentropy(), metrics=['accuracy'])

# All tf.keras.(Model/Sequential/Functional) methods/properties are accessible
# from Vmodel

model.summary()
model.get_config()
model.get_weights()
model.layers

# Create random example data
x = np.random.rand(3, 10, 100)
y = np.random.randint(9, size=(3, 10, 10))
xval = np.random.rand(1, 10, 100)
yval = np.random.randint(9, size=(1,10,10))

# Only difference, model.fit requires validation_data (tf.data.Dataset, or
# other container
history = model.fit(x, y, validation_data=(xval, yval), epochs=10, verbose=0)

# Calling model.surface_plot() returns a plotly.graph_objs.Figure
# model.surface_plot() will attempt to display the figure inline

fig = model.surface_plot()

# fig can save an interactive plot to an html file,
fig.write_html("surface_plot.html")

# or display the plot in jupyter notebook/lab or other compatible tool.
fig.show()
Owner
Research analyst
Visualize the bitcoin blockchain from your local node

Project Overview A new feature in Bitcoin Core 0.20 allows users to dump the state of the blockchain (the UTXO set) using the command dumptxoutset. I'

18 Sep 11, 2022
Blender addon that creates a temporary window of any type from the 3D View.

CreateTempWindow2.8 Blender addon that creates a temporary window of any type from the 3D View. Features Can the following window types: 3D View Graph

3 Nov 27, 2022
Data Visualizer for Super Mario Kart (SNES)

Data Visualizer for Super Mario Kart (SNES)

MrL314 21 Nov 20, 2022
Create a table with row explanations, column headers, using matplotlib

Create a table with row explanations, column headers, using matplotlib. Intended usage was a small table containing a custom heatmap.

4 Aug 14, 2022
An XLSX spreadsheet renderer for Django REST Framework.

drf-renderer-xlsx provides an XLSX renderer for Django REST Framework. It uses OpenPyXL to create the spreadsheet and returns the data.

The Wharton School 166 Dec 01, 2022
Simple, realtime visualization of neural network training performance.

pastalog Simple, realtime visualization server for training neural networks. Use with Lasagne, Keras, Tensorflow, Torch, Theano, and basically everyth

Rewon Child 416 Dec 29, 2022
A simple code for plotting figure, colorbar, and cropping with python

Python Plotting Tools This repository provides a python code to generate figures (e.g., curves and barcharts) that can be used in the paper to show th

Guanying Chen 134 Jan 02, 2023
Boltzmann visualization - Visualize the Boltzmann distribution for simple quantum models of molecular motion

Boltzmann visualization - Visualize the Boltzmann distribution for simple quantum models of molecular motion

1 Jan 22, 2022
Python & Julia port of codes in excellent R books

X4DS This repo is a collection of Python & Julia port of codes in the following excellent R books: An Introduction to Statistical Learning (ISLR) Stat

Gitony 5 Jun 21, 2022
🎨 Python Echarts Plotting Library

pyecharts Python ❤️ ECharts = pyecharts English README 📣 简介 Apache ECharts (incubating) 是一个由百度开源的数据可视化,凭借着良好的交互性,精巧的图表设计,得到了众多开发者的认可。而 Python 是一门富有表达

pyecharts 13.1k Jan 03, 2023
A Python toolbox for gaining geometric insights into high-dimensional data

"To deal with hyper-planes in a 14 dimensional space, visualize a 3D space and say 'fourteen' very loudly. Everyone does it." - Geoff Hinton Overview

Contextual Dynamics Laboratory 1.8k Dec 29, 2022
Visualize tensors in a plain Python REPL using Sparklines

Visualize tensors in a plain Python REPL using Sparklines

Shawn Presser 43 Sep 03, 2022
The official colors of the FAU as matplotlib/seaborn colormaps

FAU - Colors The official colors of Friedrich-Alexander-Universität Erlangen-Nürnberg (FAU) as matplotlib / seaborn colormaps. We support the old colo

Machine Learning and Data Analytics Lab FAU 9 Sep 05, 2022
Resources for teaching & learning practical data visualization with python.

Practical Data Visualization with Python Overview All views expressed on this site are my own and do not represent the opinions of any entity with whi

Paul Jeffries 98 Sep 24, 2022
Plot, scatter plots and histograms in the terminal using braille dots

Plot, scatter plots and histograms in the terminal using braille dots, with (almost) no dependancies. Plot with color or make complex figures - similar to a very small sibling to matplotlib. Or use t

Tammo Ippen 207 Dec 30, 2022
Application for viewing pokemon regional variants.

Pokemon Regional Variants Application Application for viewing pokemon regional variants. Run The Source Code Download Python https://www.python.org/do

Michael J Bailey 4 Oct 08, 2021
A set of useful perceptually uniform colormaps for plotting scientific data

Colorcet: Collection of perceptually uniform colormaps Build Status Coverage Latest dev release Latest release Docs What is it? Colorcet is a collecti

HoloViz 590 Dec 31, 2022
ICS-Visualizer is an interactive Industrial Control Systems (ICS) network graph that contains up-to-date ICS metadata

ICS-Visualizer is an interactive Industrial Control Systems (ICS) network graph that contains up-to-date ICS metadata (Name, company, port, user manua

QeeqBox 2 Dec 13, 2021
Python code for solving 3D structural problems using the finite element method

3DFEM Python 3D finite element code This python code allows for solving 3D structural problems using the finite element method. New features will be a

Rémi Capillon 6 Sep 29, 2022