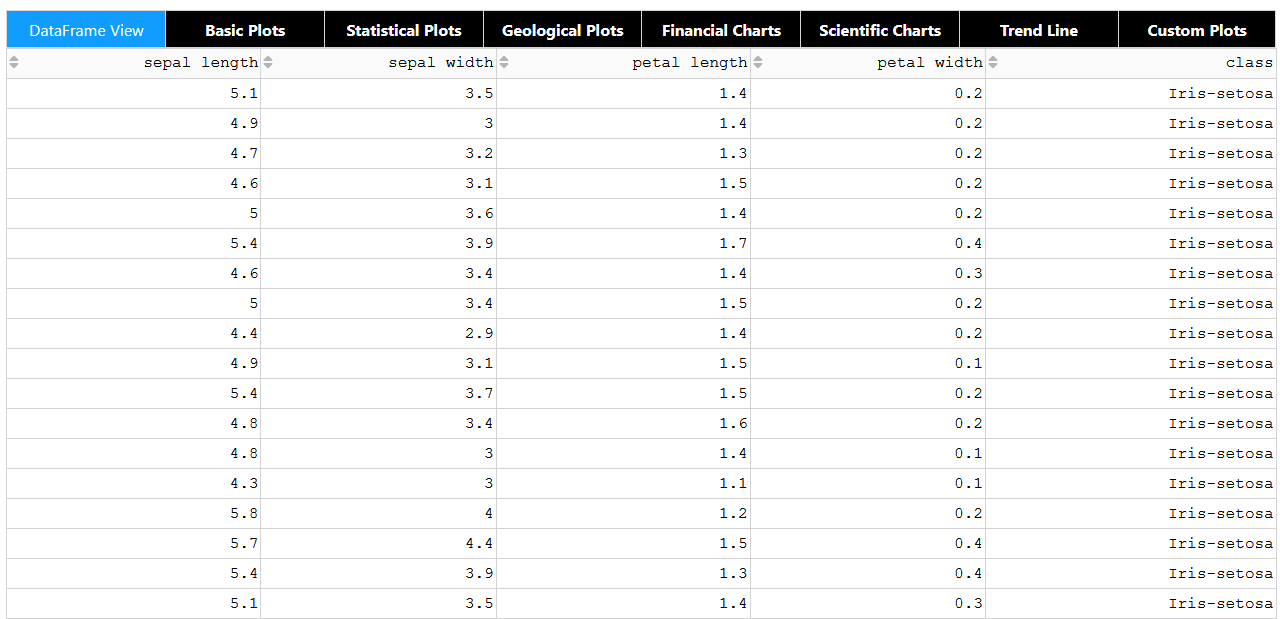
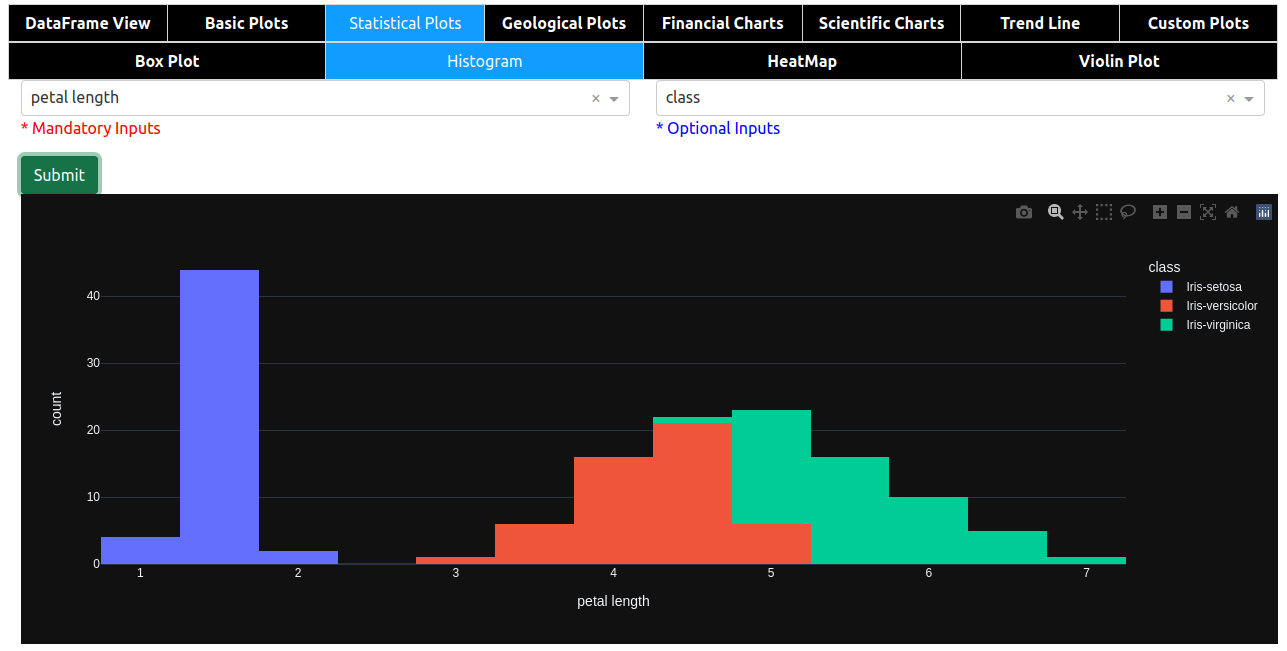
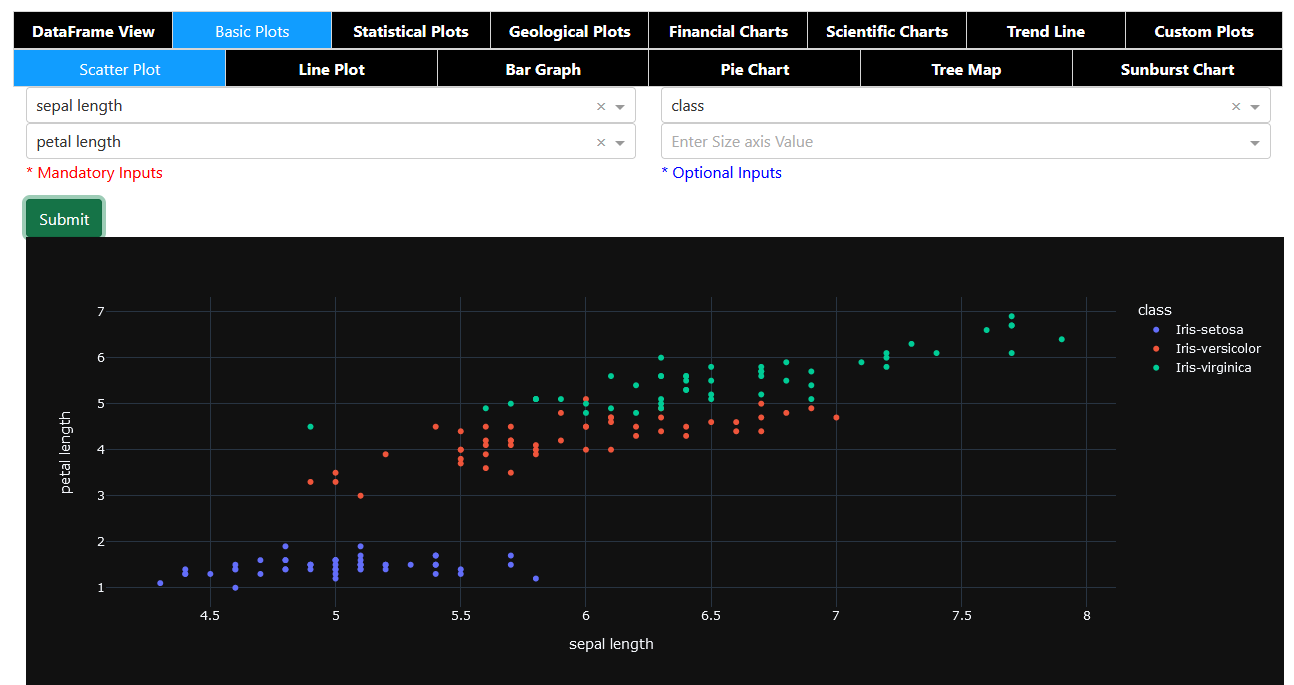
YOPO is an interactive dashboard which generates various standard plots.

Overview

YOPO (You Only Plot Once)

Python Plotly Flask

You Only Plot Once

YOPO is an interactive dashboard which generates various standard plots.you can create various graphs and charts with a click of a button. This tool uses Dash and Flask in backend.

Table of contents

Installing YOPO

To install from PyPi:

pip install yopo

To install from source:

cd <your_project>
git clone https://github.com/chekoduadarsh/YOPO-You-Only-Plot-Once.git
# or download and unzip https://github.com/AutoViML/AutoViz/archive/master.zip
# if you dont have virtualenv install from here https://packaging.python.org/en/latest/guides/installing-using-pip-and-virtual-environments/
python3 -m venv env
source env/bin/activate
git clone https://github.com/chekoduadarsh/YOPO-You-Only-Plot-Once.git
# or download and unzip https://github.com/AutoViML/AutoViz/archive/master.zip
cd yopo
python3 -m pip install .

Usage

its very easy to use YOPO, u just need to pass the dataframe and it will generate the dashboard.

A code like this will generate multiple plots like given below.

Contribute

If you find any error or need support please raise a issue. If you think you can add a feature, or help solve a bug please raise a PR This repo welcomes any kind of contributions pray

Feel free to adapt it criticize it and support it the way you like!!

License

Apache License, Version 2.0

You might also like...
This package creates clean and beautiful matplotlib plots that work on light and dark backgrounds

This package creates clean and beautiful matplotlib plots that work on light and dark backgrounds. Inspired by the work of Edward Tufte.

Moscow DEG 2021 elections plots

Построение графиков на основе публичных данных о ДЭГ в Москве в 2021г. Описание Скрипты в данном репозитории позволяют собственноручно построить графи

This plugin plots the time you spent on a tag as a histogram.

This plugin plots the time you spent on a tag as a histogram.

A minimal Python package that produces slice plots through h5m DAGMC geometry files

A minimal Python package that produces slice plots through h5m DAGMC geometry files Installation pip install dagmc_geometry_slice_plotter Python API U

MPL Plotter is a Matplotlib based Python plotting library built with the goal of delivering publication-quality plots concisely.

MPL Plotter is a Matplotlib based Python plotting library built with the goal of delivering publication-quality plots concisely.

Generate
Generate "Jupiter" plots for circular genomes

jupiter Generate "Jupiter" plots for circular genomes Description Python scripts to generate plots from ViennaRNA output. Written in "pidgin" python w

A Python function that makes flower plots.

Flower plot A Python 3.9+ function that makes flower plots. Installation This package requires at least Python 3.9. pip install

Standardized plots and visualizations in Python

Standardized plots and visualizations in Python pltviz is a Python package for standardized visualization. Routine and novel plotting approaches are f

The plottify package is makes matplotlib plots more legible

plottify The plottify package is makes matplotlib plots more legible. It's a thin wrapper around matplotlib that automatically adjusts font sizes, sca

Comments
  • Add predefined palettes as dropdown.

    Add predefined palettes as dropdown.

    Is your feature request related to a problem? An enhancement: to give the possibility to choose a color palette from a dropdown menu.

    There are too many predefined palettes at [https://plotly.com/python/builtin-colorscales/](https://plotly.com/python/builtin-colorscales/, and the menu would become too long), so a dozen should be enough.

    As a palette list I would consider:

    • Viridis
    • Magma
    • Turbo
    • Bluered
    • Hot
    • RdBu
    • YlOrRd
    • Thermal
    • Agsunset
    • Balance
    • Portland
    • Edge

    If the dropdown menu shows the palette colors (each image can be downloaded from the page) together with the name, it becomes very intuitive.

    enhancement 
    opened by Nemecsek 4
  • Give the possibility to add extra parameters.

    Give the possibility to add extra parameters.

    Is your feature request related to a problem? I am using Histograms, but the number of bins is automatic and cannot be changed. Other plot types can be optimized by adding extra parameters (i.e. to change the size of scatterplots' markers).

    Describe the solution you'd like Of course it is not possible to add parameters according to every users' needs.

    The easiest solution is to give the possibility to enter extra params into an edit box such as: Screenshot_20220218_092905

    This string can be transformed into a dictionary with eval(f'dict({ edit_box_content })'), and the dictionary then added to the plots' parameters.

    enhancement 
    opened by Nemecsek 2
  • Dataframe's index is missing among the selectable fields in X axis

    Dataframe's index is missing among the selectable fields in X axis

    As for the title, it is not possible to directly select the (unnamed) index among the X axis fields. Index is the most obvious choice for Y axis in Scatter, Line, etc.

    opened by Nemecsek 0
  • Let multiple series to be visualized in a single plot.

    Let multiple series to be visualized in a single plot.

    In Scatter, Line, Bar (and possibly other plots) it would be nice to visualize multiple series on the same figure. This would mean to select not only a single Y axis value, but to allow multiple selections (at least one).

    To keep things simple, I would draw all of them on the same figure, avoiding at the moment to provide sub figures.

    enhancement 
    opened by Nemecsek 1
Releases(alpha)
  • alpha(Feb 15, 2022)

Owner
ADARSH C
Python | Machine Learning | Deep Learning | Flask | mongodb | Embedded systems
ADARSH C
又一个云探针

ServerStatus-Murasame 感谢ServerStatus-Hotaru,又一个云探针诞生了(大雾 本项目在ServerStatus-Hotaru的基础上使用fastapi重构了服务端,部分修改了客户端与前端 项目还在非常原始的阶段,可能存在严重的问题 演示站:https://stat

6 Oct 19, 2021
Simple and fast histogramming in Python accelerated with OpenMP.

pygram11 Simple and fast histogramming in Python accelerated with OpenMP with help from pybind11. pygram11 provides functions for very fast histogram

Doug Davis 28 Dec 14, 2022
Movies-chart - A CLI app gets the top 250 movies of all time from imdb.com and the top 100 movies from rottentomatoes.com

movies-chart This CLI app gets the top 250 movies of all time from imdb.com and

3 Feb 17, 2022
Easily configurable, chart dashboards from any arbitrary API endpoint. JSON config only

Flask JSONDash Easily configurable, chart dashboards from any arbitrary API endpoint. JSON config only. Ready to go. This project is a flask blueprint

Chris Tabor 3.3k Dec 31, 2022
Voilà, install macOS on ANY Computer! This is really and magic easiest way!

OSX-PROXMOX - Run macOS on ANY Computer - AMD & Intel Install Proxmox VE v7.02 - Next, Next & Finish (NNF). Open Proxmox Web Console - Datacenter N

Gabriel Luchina 654 Jan 09, 2023
GitHubPoster - Make everything a GitHub svg poster

GitHubPoster Make everything a GitHub svg poster 支持 Strava 开心词场 扇贝 Nintendo Switch GPX 多邻国 Issue

yihong 1.3k Jan 02, 2023
Small binja plugin to import header file to types

binja-import-header (v1.0.0) Author: matteyeux Import header file to Binary Ninja types view Description: Binary Ninja plugin to import types from C h

matteyeux 15 Dec 10, 2022
This GitHub Repository contains Data Analysis projects that I have completed so far! While most of th project are focused on Data Analysis, some of them are also put here to show off other skills that I have learned.

Welcome to my Data Analysis projects page! This GitHub Repository contains Data Analysis projects that I have completed so far! While most of th proje

Kyle Dini 1 Jan 31, 2022
Attractors is a package for simulation and visualization of strange attractors.

attractors Attractors is a package for simulation and visualization of strange attractors. Installation The simplest way to install the module is via

Vignesh M 45 Jul 31, 2022
Implementation of SOMs (Self-Organizing Maps) with neighborhood-based map topologies.

py-self-organizing-maps Simple implementation of self-organizing maps (SOMs) A SOM is an unsupervised method for learning a mapping from a discrete ne

Jonas Grebe 6 Nov 22, 2022
Bokeh Plotting Backend for Pandas and GeoPandas

Pandas-Bokeh provides a Bokeh plotting backend for Pandas, GeoPandas and Pyspark DataFrames, similar to the already existing Visualization feature of

Patrik Hlobil 822 Jan 07, 2023
China and India Population and GDP Visualization

China and India Population and GDP Visualization Historical Population Comparison between India and China This graph shows the population data of Indi

Nicolas De Mello 10 Oct 27, 2021
在原神中使用围栏绘图

yuanshen_draw 在原神中使用围栏绘图 文件说明 toLines.py 将一张图片转换为对应的线条集合,视频可以按帧转换。 draw.py 在原神家园里绘制一张线条图。 draw_video.py 在原神家园里绘制视频(自动按帧摆放,截图(win)并回收) cat_to_video.py

14 Oct 08, 2022
An animation engine for explanatory math videos

Powered By: An animation engine for explanatory math videos Hi there, I'm Zheer 👋 I'm a Software Engineer and student!! 🌱 I’m currently learning eve

Zaheer ud Din Faiz 2 Nov 04, 2021
A customized interface for single cell track visualisation based on pcnaDeep and napari.

pcnaDeep-napari A customized interface for single cell track visualisation based on pcnaDeep and napari. 👀 Under construction You can get test image

ChanLab 2 Nov 07, 2021
Scientific Visualization: Python + Matplotlib

An open access book on scientific visualization using python and matplotlib

Nicolas P. Rougier 8.6k Dec 31, 2022
HW 2: Visualizing interesting datasets

HW 2: Visualizing interesting datasets Check out the project instructions here! Mean Earnings per Hour for Males and Females My first graph uses data

7 Oct 27, 2021
A site that displays up to date COVID-19 stats, powered by fastpages.

https://covid19dashboards.com This project was built with fastpages Background This project showcases how you can use fastpages to create a static das

GitHub 1.6k Jan 07, 2023
Python scripts for plotting audiograms and related data from Interacoustics Equinox audiometer and Otoaccess software.

audiometry Python scripts for plotting audiograms and related data from Interacoustics Equinox 2.0 audiometer and Otoaccess software. Maybe similar sc

Hamilton Lab at UT Austin 2 Jun 15, 2022
Sci palettes for matplotlib/seaborn

sci palettes for matplotlib/seaborn Installation python3 -m pip install sci-palettes Usage import seaborn as sns import matplotlib.pyplot as plt impor

Qingdong Su 2 Jun 07, 2022