BrowZen correlates your emotional states with the web sites you visit to give you actionable insights about how you spend your time browsing the web.

Overview

BrowZen

BrowZen correlates your emotional states with the web sites you visit to give you actionable insights about how you spend your time browsing the web.

How It Works

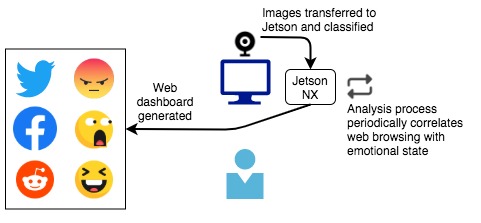
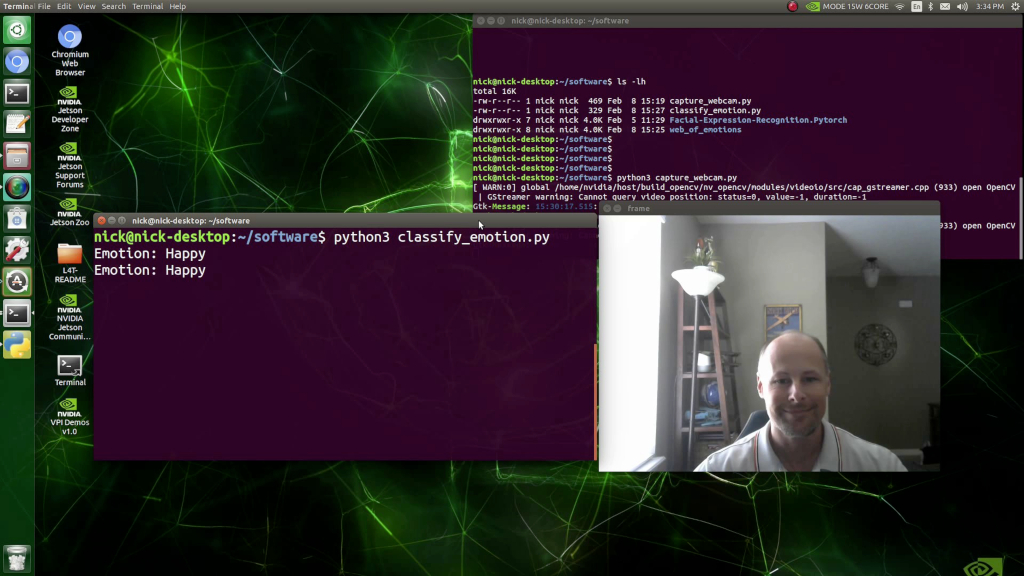
A webcam attached to an NVIDIA Jetson Xavier NX captures periodic images of the user of the computer as a background process. These images are classified (see classify_emotion.py) by a VGG19 convolutional neural network that has been pretrained to recognize seven emotional states ("Angry", "Disgust", "Fear", "Happy", "Sad", "Surprise", and "Neutral"). Observations (emotional state, datetime stamp) are recorded in an SQLite3 database. For privacy protection, images are destroyed after classification, and all processing takes place locally—nothing is sent to the cloud.

Next, analysis.py connects to the SQLite3 database that stores web history in Chrome/Chromium and correlates web site visit times with the database of emotional state observations created by the classification step. The result of the analysis, the sum of each emotional state observed while visiting each web site, is stored in an SQLite3 database table.

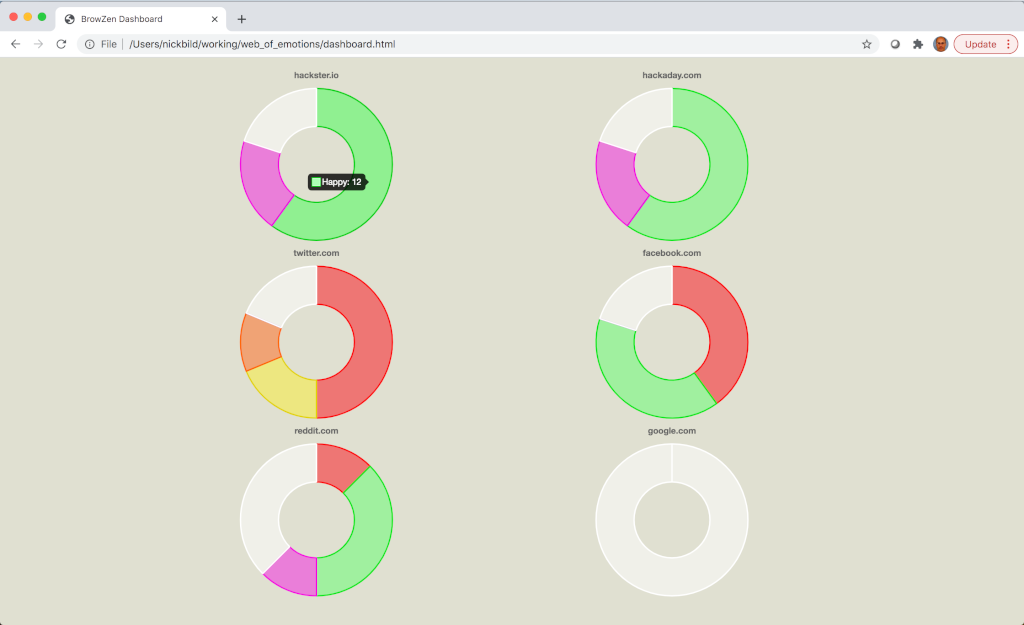
Finally, the analysis results are used to generate a web dashboard (generate_dashboard.py) to provide a simple way to visualize, on average, how each web site one visits impacts their emotional state. The web dashboard (dashboard.html) relies on only HTML5 and JavaScript.

Media

Demo Video: YouTube

The web dashboard, giving an overview of emotional reactions during visits to various websites (high resolution): Dashboard
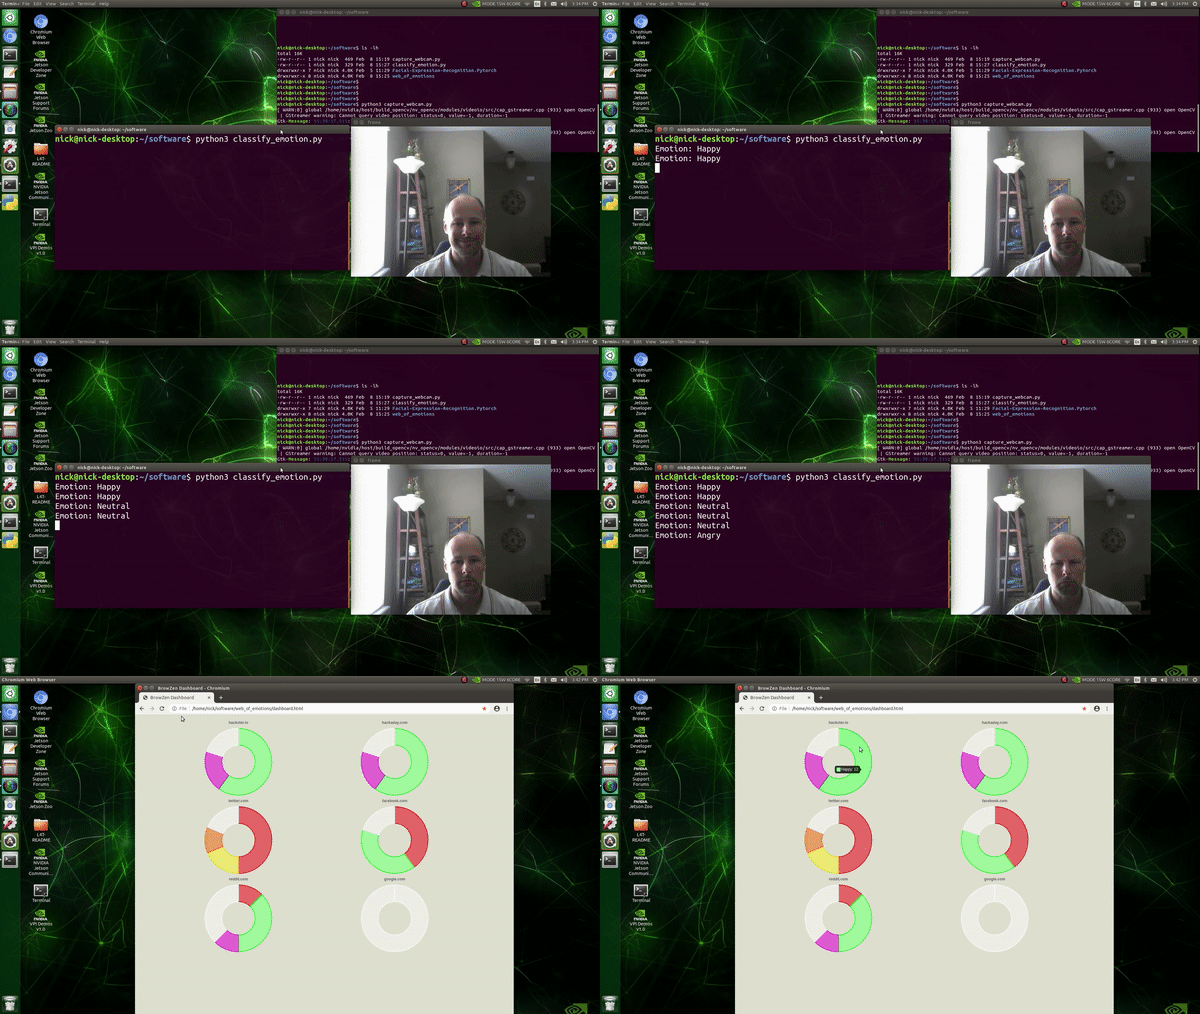
Classifying emotions in real-time (high resolution): Classification
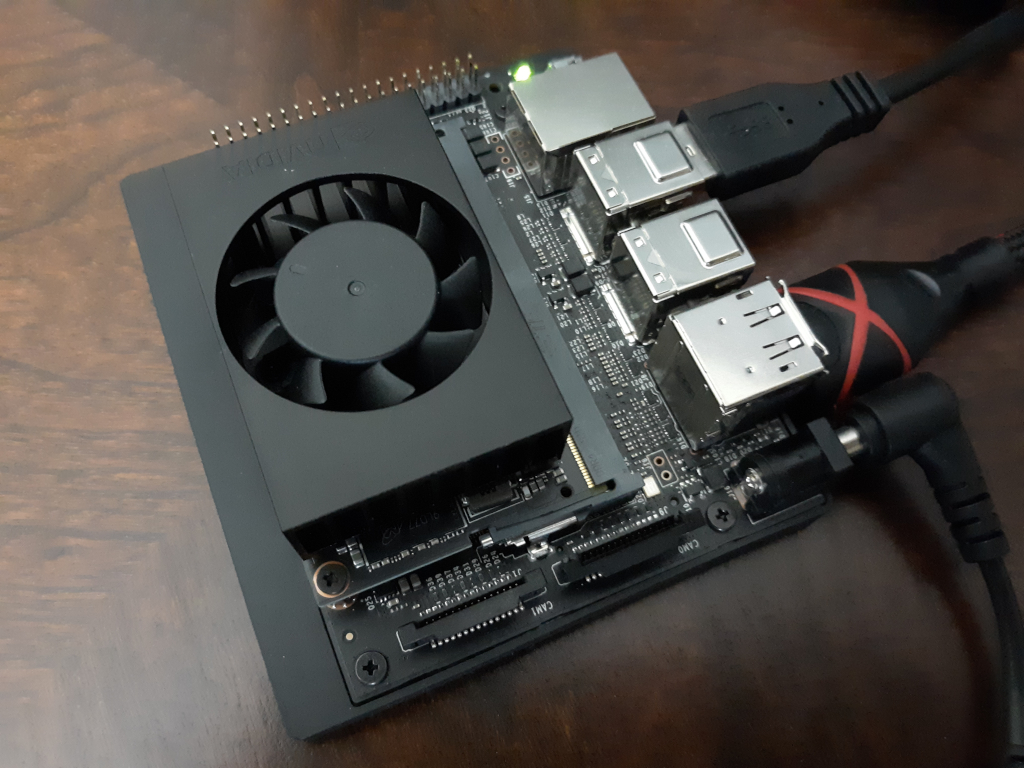
Jetson Xavier NX (high resolution): Jetson

Future Direction

It may be useful to create a browser plugin that displays a small, always-visible icon representing past emotions experienced when visiting the current website. This would serve as a quick reminder of past experiences that may modify current behavior.

I would like to also explore other areas, beyond web browsing, where this idea may be helpful.

Bill of Materials

  • 1 x NVIDIA Jetson Xavier NX
  • 1 x USB webcam

About the Author

Nick A. Bild, MS

Owner
Nick Bild
R&D, creativity, and building the next big thing you never knew you wanted are my specialties.
Nick Bild
Small project demonstrating the use of Grafana and InfluxDB for monitoring the speed of an internet connection

Speedtest monitor for Grafana A small project that allows internet speed monitoring using Grafana, InfluxDB 2 and Speedtest. Demo Requirements Docker

Joshua Ghali 3 Aug 06, 2021
Lightspin AWS IAM Vulnerability Scanner

Red-Shadow Lightspin AWS IAM Vulnerability Scanner Description Scan your AWS IAM Configuration for shadow admins in AWS IAM based on misconfigured den

Lightspin 90 Dec 14, 2022
termplotlib is a Python library for all your terminal plotting needs.

termplotlib termplotlib is a Python library for all your terminal plotting needs. It aims to work like matplotlib. Line plots For line plots, termplot

Nico Schlömer 553 Dec 30, 2022
This is a super simple visualization toolbox (script) for transformer attention visualization ✌

Trans_attention_vis This is a super simple visualization toolbox (script) for transformer attention visualization ✌ 1. How to prepare your attention m

Mingyu Wang 3 Jul 09, 2022
Python package for hypergraph analysis and visualization.

The HyperNetX library provides classes and methods for the analysis and visualization of complex network data. HyperNetX uses data structures designed to represent set systems containing nested data

Pacific Northwest National Laboratory 304 Dec 27, 2022
A simple python script using Numpy and Matplotlib library to plot a Mohr's Circle when given a two-dimensional state of stress.

Mohr's Circle Calculator This is a really small personal project done for Department of Civil Engineering, Delhi Technological University (formerly, D

Agyeya Mishra 0 Jul 17, 2021
Visualization Website by using Dash and Heroku

Visualization Website by using Dash and Heroku You can visit the website https://payroll-expense-analysis.herokuapp.com/ In this project, I am interes

YF Liu 1 Jan 14, 2022
Sparkling Pandas

SparklingPandas SparklingPandas aims to make it easy to use the distributed computing power of PySpark to scale your data analysis with Pandas. Sparkl

366 Oct 27, 2022
Python+Numpy+OpenGL: fast, scalable and beautiful scientific visualization

Python+Numpy+OpenGL: fast, scalable and beautiful scientific visualization

Glumpy 1.1k Jan 05, 2023
With Holoviews, your data visualizes itself.

HoloViews Stop plotting your data - annotate your data and let it visualize itself. HoloViews is an open-source Python library designed to make data a

HoloViz 2.3k Jan 04, 2023
Type-safe YAML parser and validator.

StrictYAML StrictYAML is a type-safe YAML parser that parses and validates a restricted subset of the YAML specification. Priorities: Beautiful API Re

Colm O'Connor 1.2k Jan 04, 2023
Fastest Gephi's ForceAtlas2 graph layout algorithm implemented for Python and NetworkX

ForceAtlas2 for Python A port of Gephi's Force Atlas 2 layout algorithm to Python 2 and Python 3 (with a wrapper for NetworkX and igraph). This is the

Bhargav Chippada 227 Jan 05, 2023
Manim is an animation engine for explanatory math videos.

A community-maintained Python framework for creating mathematical animations.

12.4k Dec 30, 2022
The Metabolomics Integrator (MINT) is a post-processing tool for liquid chromatography-mass spectrometry (LCMS) based metabolomics.

MINT (Metabolomics Integrator) The Metabolomics Integrator (MINT) is a post-processing tool for liquid chromatography-mass spectrometry (LCMS) based m

Sören Wacker 0 May 04, 2022
🌀❄️🌩️ This repository contains some examples for creating 2d and 3d weather plots using matplotlib and cartopy libraries in python3.

Weather-Plotting 🌀 ❄️ 🌩️ This repository contains some examples for creating 2d and 3d weather plots using matplotlib and cartopy libraries in pytho

Giannis Dravilas 21 Dec 10, 2022
DrawBot lets you draw images taken from the internet on Skribbl.io, Gartic Phone and Paint

DrawBot You don't speak french? No worries, english translation is over here. C'est quoi ? DrawBot est un logiciel codé par V2F qui va prendre possess

V2F 205 Jan 01, 2023
WebApp served by OAK PoE device to visualize various streams, metadata and AI results

DepthAI PoE WebApp | Bootstrap 4 & Vue.js SPA Dashboard Based on dashmin (https:

Luxonis 6 Apr 09, 2022
Python package that generates hardware pinout diagrams as SVG images

PinOut A Python package that generates hardware pinout diagrams as SVG images. The package is designed to be quite flexible and works well for general

336 Dec 20, 2022
Focus on Algorithm Design, Not on Data Wrangling

The dataTap Python library is the primary interface for using dataTap's rich data management tools. Create datasets, stream annotations, and analyze model performance all with one library.

Zensors 37 Nov 25, 2022
D-Analyst : High Performance Visualization Tool

D-Analyst : High Performance Visualization Tool D-Analyst is a high performance data visualization built with python and based on OpenGL. It allows to

4 Apr 14, 2022