The Metabolomics Integrator (MINT) is a post-processing tool for liquid chromatography-mass spectrometry (LCMS) based metabolomics.

Overview

CII Best Practices Github All Releases

MINT (Metabolomics Integrator)

The Metabolomics Integrator (MINT) is a post-processing tool for liquid chromatography-mass spectrometry (LCMS) based metabolomics. Metabolomics is the study of all metabolites (small chemical compounds) in a biological sample e.g. from bacteria or a human blood sample. The metabolites can be used to define biomarkers used in medicine to find treatments for diseases or for the development of diagnostic tests or for the identification of pathogens such as methicillin resistant Staphylococcus aureus (MRSA). More information on how to install and run the program can be found in the Documentation or check out the Quickstart to jump right into it.

Browser based as standalone application or server based

A demo server is available here. Be mindful, you share the server with others.

Metabolomics with Python

MINT originally started as Python project. The core of MINT is a Python class for targeted metabolomics that can be used independent of the graphical application.

from ms_mint.notebook import Mint
mint.ms_files = glob('/path/to/files/*mzML')
mint.peaklist_files = '/path/to/peaklist/file/peaklist.csv'
mint.run()
mint.results

Mint Jupyter Results

Contributions are welcome

MINT integrates open-source software and packages into a Python library for metabolomics with a browser based GUI. It is programmed by scientists for scientists to contribute to better and faster science integrating best practices of data management and computer science. Contributions are welcome that improve the efficiency of the code, bug fixes, feature implementations, security enhancements among others. If you want to contribute to MINT please send me a notification.

How to contribute

Errors, Feedback, Feature Requests

If you encounter an error, if you have a request for a new feature, or for general feedback, please open a new ticket at the issue tracker.

Code contributions

If your are up to enhance the codebase yourself, we ask you to followowing steps:

  1. fork the repository
  2. implement the new feature or bug-fix
  3. add corresponding tests
  4. run flake8
  5. submit a pull request

Code standards

Before submitting a pull request please run flake8.

Get in touch

Open an issue or join the slack channel.

Acknowledgements

This project would not be possible without the help of the open-source community. The tools and resources provided by GitHub, Docker-Hub, the Python Package Index, as well the answers from dedicated users on Stackoverflow and the Plotly community, as well as the free open-source packages used are the foundation of this project. Several people have made direct contributions to the codebase and we are extremely grateful for that.

  • @rokm refactored the specfile for Pyinstaller to create a windows package.
  • @bucknerns helped with the configuration of the versioneer file.

Last but not least, we want to thank all the users and early adopters that drive the development with feature requests and bug reports.

You might also like...
Simple spectra visualization tool for astronomers

SpecViewer A simple visualization tool for astronomers. Dependencies Python = 3.7.4 PyQt5 = 5.15.4 pyqtgraph == 0.10.0 numpy = 1.19.4 How to use py

A visualization tool made in Pygame for various pathfinding algorithms.

Pathfinding-Visualizer 🚀 A visualization tool made in Pygame for various pathfinding algorithms. Pathfinding is closely related to the shortest path

A command line tool for visualizing CSV/spreadsheet-like data

PerfPlotter Read data from CSV files using pandas and generate interactive plots using bokeh, which can then be embedded into HTML pages and served by

simple tool to paint axis x and y

simple tool to paint axis x and y

A System Metrics Monitoring Tool Built using Python3 , rabbitmq,Grafana and InfluxDB. Setup using docker compose. Use to monitor system performance with graphical interface of grafana , storage of influxdb and message queuing of rabbitmq Bioinformatics tool for exploring RNA-Protein interactions
Bioinformatics tool for exploring RNA-Protein interactions

Explore RNA-Protein interactions. RNPFind is a bioinformatics tool. It takes an RNA transcript as input and gives a list of RNA binding protein (RBP)

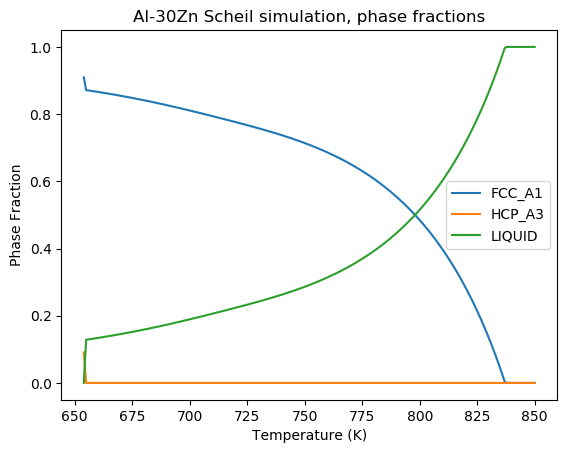
A Scheil-Gulliver simulation tool using pycalphad.

scheil A Scheil-Gulliver simulation tool using pycalphad. import matplotlib.pyplot as plt from pycalphad import Database, variables as v from scheil i

A tool for automatically generating 3D printable STLs from freely available lidar scan data.

mini-map-maker A tool for automatically generating 3D printable STLs from freely available lidar scan data. Screenshots Tutorial To use this script, g

The Spectral Diagram (SD) is a new tool for the comparison of time series in the frequency domain

The Spectral Diagram (SD) is a new tool for the comparison of time series in the frequency domain. The SD provides a novel way to display the coherence function, power, amplitude, phase, and skill score of discrete frequencies of two time series. Each SD summarises these quantities in a single plot for multiple targeted frequencies.

Comments
  • error

    error

    Hello, first of all congratulations for the application. I tried to run the application but got an error. First of all, the application is constantly updating itself in the part with dash. Secondly, when it comes to the upload data part, the following calback error appears.

    Callback error updating {"index": "ms-uploader-output", "type": "output"}, "children" TypeError: expected str, bytes or os.PathLike object, not list fn_new = P(ms_dir) / P(fn).name I couldn't run it, it seems to load the data, but it doesn't, giving these errors.

    (I guess P(fn).name doesn't see it as path.)

    opened by hilaluzunoglu 0
Releases(0.0.56)
Owner
Sören Wacker
Research Associate in the Lewis Research Group at the University of Calgary.
Sören Wacker
Cartopy - a cartographic python library with matplotlib support

Cartopy is a Python package designed to make drawing maps for data analysis and visualisation easy. Table of contents Overview Get in touch License an

1.2k Jan 01, 2023
Library for exploring and validating machine learning data

TensorFlow Data Validation TensorFlow Data Validation (TFDV) is a library for exploring and validating machine learning data. It is designed to be hig

688 Jan 03, 2023
CLAHE Contrast Limited Adaptive Histogram Equalization

A simple code to process images using contrast limited adaptive histogram equalization. Image processing is becoming a major part of data processig.

Happy N. Monday 4 May 18, 2022
GD-UltraHack - A Mod Menu for Geometry Dash. Specifically a MegahackV5 clone in Python. Only for Windows

GD UltraHack: The Mod Menu that Nobody asked for. This is a mod menu for the gam

zeo 1 Jan 05, 2022
Generate a roam research like Network Graph view from your Notion pages.

Notion Graph View Export Notion pages to a Roam Research like graph view.

Steve Sun 214 Jan 07, 2023
A way of looking at COVID-19 data that I haven't seen before.

Visualizing Omicron: COVID-19 Deaths vs. Cases Click here for other countries. Data is from Our World in Data/Johns Hopkins University. About this pro

1 Jan 10, 2022
A python visualization of the A* path finding algorithm

A python visualization of the A* path finding algorithm. It allows you to pick your start, end location and make obstacles and then view the process of finding the shortest path. You can also choose

Kimeon 4 Aug 02, 2022
Small project demonstrating the use of Grafana and InfluxDB for monitoring the speed of an internet connection

Speedtest monitor for Grafana A small project that allows internet speed monitoring using Grafana, InfluxDB 2 and Speedtest. Demo Requirements Docker

Joshua Ghali 3 Aug 06, 2021
Generate knowledge graphs with interesting geometries, like lattices

Geometric Graphs Generate knowledge graphs with interesting geometries, like lattices. Works on Python 3.9+ because it uses cool new features. Get out

Charles Tapley Hoyt 5 Jan 03, 2022
在原神中使用围栏绘图

yuanshen_draw 在原神中使用围栏绘图 文件说明 toLines.py 将一张图片转换为对应的线条集合,视频可以按帧转换。 draw.py 在原神家园里绘制一张线条图。 draw_video.py 在原神家园里绘制视频(自动按帧摆放,截图(win)并回收) cat_to_video.py

14 Oct 08, 2022
Kglab - an abstraction layer in Python for building knowledge graphs

Graph Data Science: an abstraction layer in Python for building knowledge graphs, integrated with popular graph libraries – atop Pandas, RDFlib, pySHACL, RAPIDS, NetworkX, iGraph, PyVis, pslpython, p

derwen.ai 466 Jan 09, 2023
A set of three functions, useful in geographical calculations of different sorts

GreatCircle A set of three functions, useful in geographical calculations of different sorts. Available for PHP, Python, Javascript and Ruby. Live dem

72 Sep 30, 2022
Scientific Visualization: Python + Matplotlib

An open access book on scientific visualization using python and matplotlib

Nicolas P. Rougier 8.6k Dec 31, 2022
Simple CLI python app to show a stocks graph performance. Made with Matplotlib and Tiingo.

stock-graph-python Simple CLI python app to show a stocks graph performance. Made with Matplotlib and Tiingo. Tiingo API Key You will need to add your

Toby 3 May 14, 2022
This GitHub Repository contains Data Analysis projects that I have completed so far! While most of th project are focused on Data Analysis, some of them are also put here to show off other skills that I have learned.

Welcome to my Data Analysis projects page! This GitHub Repository contains Data Analysis projects that I have completed so far! While most of th proje

Kyle Dini 1 Jan 31, 2022
Getting started with Python, Dash and Plot.ly for the Data Dashboards team

data_dashboards Getting started with Python, Dash and Plot.ly for the Data Dashboards team Getting started MacOS users: # Install the pyenv version ma

Department for Levelling Up, Housing and Communities 1 Nov 08, 2021
Project coded in Python using Pandas to look at changes in chase% for batters facing a pitcher first time through the order vs. thrid time

Project coded in Python using Pandas to look at changes in chase% for batters facing a pitcher first time through the order vs. thrid time

Jason Kraynak 1 Jan 07, 2022
EPViz is a tool to aid researchers in developing, validating, and reporting their predictive modeling outputs.

EPViz (EEG Prediction Visualizer) EPViz is a tool to aid researchers in developing, validating, and reporting their predictive modeling outputs. A lig

Jeff 2 Oct 19, 2022
Plotting library for IPython/Jupyter notebooks

bqplot 2-D plotting library for Project Jupyter Introduction bqplot is a 2-D visualization system for Jupyter, based on the constructs of the Grammar

3.4k Dec 30, 2022
a robust room presence solution for home automation with nearly no false negatives

Argos Room Presence This project builds a room presence solution on top of Argos. Using just a cheap raspberry pi zero w (plus an attached pi camera,

Angad Singh 46 Sep 18, 2022