Collection of data visualizing projects through Tableau, Data Wrapper, and Power BI

Overview

Data-Visualization-Projects

Collection of data visualizing projects through Tableau, Data Wrapper, and Power BI

Indigenous-Brands-Social-Movements

Python(Pandas, NumPy, Re, Matplotlib), Data Visualization(Data Wrapper)

Selected as a part of competitive UC Berkeley Data Discovery Research Programs, "Indigenous Brands & Social Movements"

  • Cleaned datasets of trademarks owned by Native American Tribes through eliminating unnecessary columns, filling NAs with 0 other values
  • Based on the cleaned datasets, visualized locations of the trademarks on maps through usage of data visualization tool called DataWrapper

Research Program Description

Have you noticed how many brands in the marketplace use indigenous/Native American - oriented terms and imagery? From the notorious Washington Team to the logo on Land of Lakes butter, indigenous imagery and appropriation is everywhere, and worthy of serious study and data analysis. This project aims to bring the work of social movements and activism to a data-intensive study of First Nations brands and trademarks in order to chart a path forward. In this project, we will study how many of these terms are owned by native vs. non-native entities, study how these brands have changed over time, and how the law might be better deployed to protect ownership of indigenously oriented trademarks, and encourage retiring marks that are considered offensive or appropriative.

  • University of California, Berkeley / Data Discovery Research Program Project

Visualization of Homeless in the States using Tableau

Screen Shot 2021-08-18 at 9 07 04 PM

  • Dataset of statistics of homeless from Kaggle and Github

  • This dashboard answers the followings:

    • Which state has the most number of homeless?
    • Is there a difference of the number of homeless between 2012 and 2013?
    • In what state and how many of homeless people of each type(Unsheltered, families, veterans, unaccompanied children, and chronic) are there?
  • This dashboard is composed of the followings:

    • Bubbles of the number of homeless by the States
    • Map of the United States by the number of homeless
    • Stacked bar of the number of homeless for each type with selected State
    • Side-by-Side bar chart of the number of homeless in 2012 and 2013
  • Individual Project by Jinwoo(Roy) Yoon

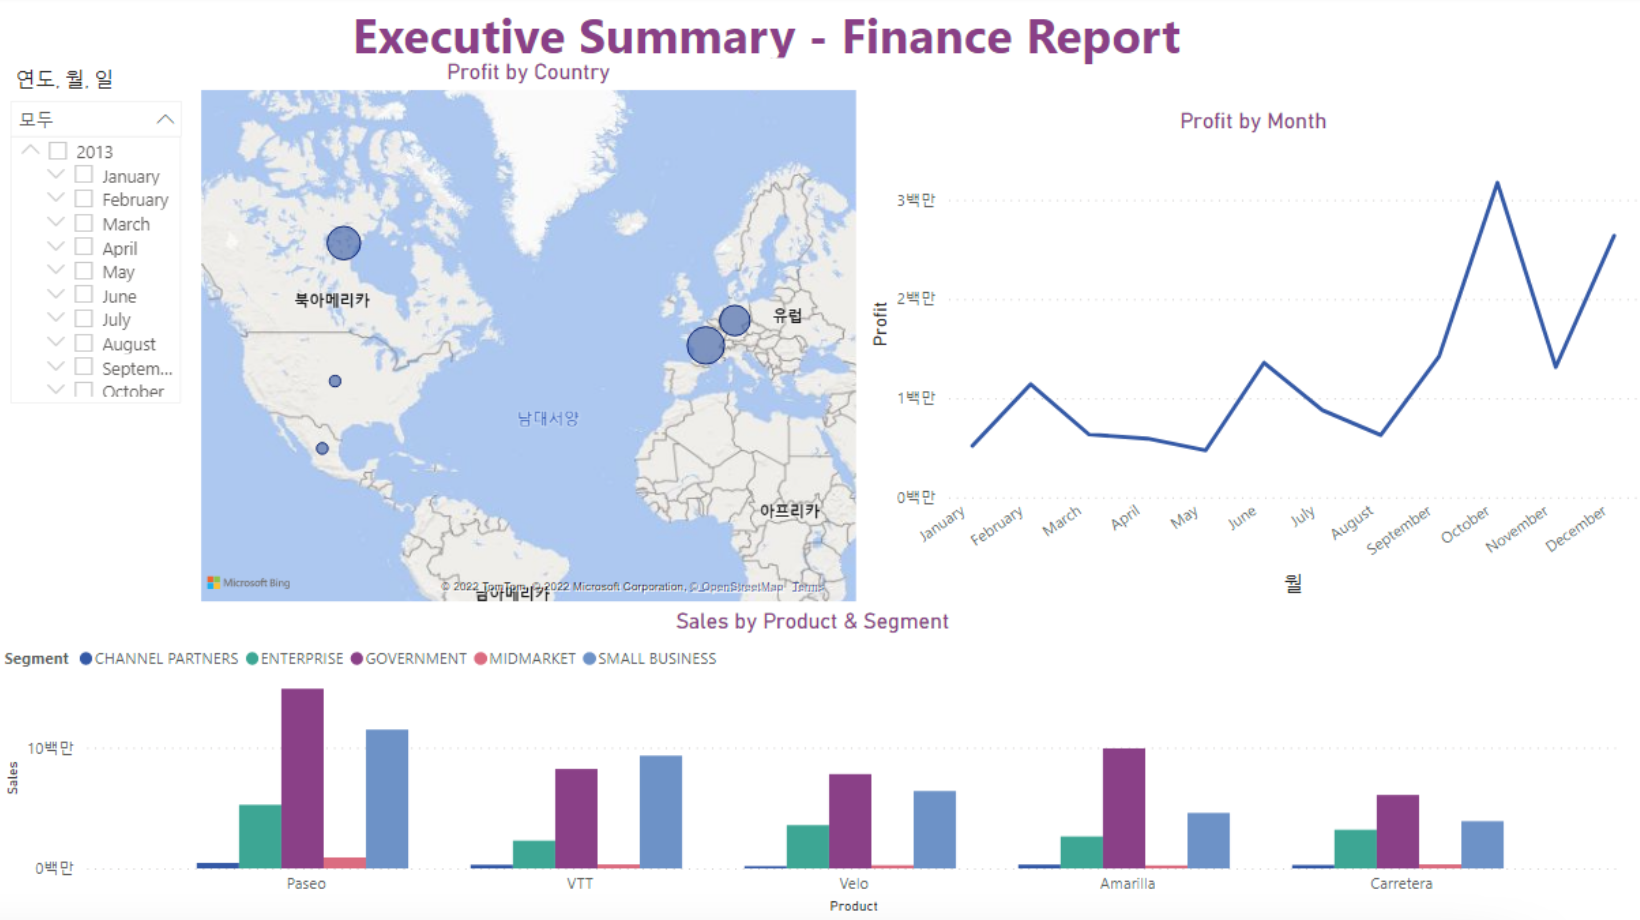
Finance Report using PowerBI

Screen Shot 2022-02-05 at 3 47 12 PM

  • Sample dataset (From Power BI) of a company's sales of products with various countries and dates
  • This dashboard answers the followings:
    • Which month/year was the most profitable?
    • In which country was the most profitable?
    • Which segment should the company invest more?
  • This dashboard is composed of the followings:
    • Map of the North America and Europe showing the amount of sales
    • Graph of profit from sales by months
    • Bar chart of sales by products/segments
  • Individual Project by Jinwoo(Roy) Yoon
Owner
Jinwoo(Roy) Yoon
Rising Senior at University of California, Berkeley Data Science (May 2023)
Jinwoo(Roy) Yoon
Python implementation of the Density Line Chart by Moritz & Fisher.

PyDLC - Density Line Charts with Python Python implementation of the Density Line Chart (Moritz & Fisher, 2018) to visualize large collections of time

Charles L. Bérubé 10 Jan 06, 2023
A minimalistic wrapper around PyOpenGL to save development time

glpy glpy is pyOpenGl wrapper which lets you work with pyOpenGl easily.It is not meant to be a replacement for pyOpenGl but runs on top of pyOpenGl to

Abhinav 9 Apr 02, 2022
An interactive GUI for WhiteboxTools in a Jupyter-based environment

whiteboxgui An interactive GUI for WhiteboxTools in a Jupyter-based environment GitHub repo: https://github.com/giswqs/whiteboxgui Documentation: http

Qiusheng Wu 105 Dec 15, 2022
Simple function to plot multiple barplots in the same figure.

Simple function to plot multiple barplots in the same figure. Supports padding and custom color.

Matthias Jakobs 2 Feb 21, 2022
Wikipedia WordCloud App generate Wikipedia word cloud art created using python's streamlit, matplotlib, wikipedia and wordcloud packages

Wikipedia WordCloud App Wikipedia WordCloud App generate Wikipedia word cloud art created using python's streamlit, matplotlib, wikipedia and wordclou

Siva Prakash 5 Jan 02, 2022
Matplotlib tutorial for beginner

matplotlib is probably the single most used Python package for 2D-graphics. It provides both a very quick way to visualize data from Python and publication-quality figures in many formats. We are goi

Nicolas P. Rougier 2.6k Dec 28, 2022
Open-source demos hosted on Dash Gallery

Dash Sample Apps This repository hosts the code for over 100 open-source Dash apps written in Python or R. They can serve as a starting point for your

Plotly 2.7k Jan 07, 2023
GD-UltraHack - A Mod Menu for Geometry Dash. Specifically a MegahackV5 clone in Python. Only for Windows

GD UltraHack: The Mod Menu that Nobody asked for. This is a mod menu for the gam

zeo 1 Jan 05, 2022
Editor and Presenter for Manim Generated Content.

Editor and Presenter for Manim Generated Content. Take a look at the Working Example. More information can be found on the documentation. These Browse

Manim Community 149 Dec 29, 2022
Complex heatmaps are efficient to visualize associations between different sources of data sets and reveal potential patterns.

Make Complex Heatmaps Complex heatmaps are efficient to visualize associations between different sources of data sets and reveal potential patterns. H

Zuguang Gu 973 Jan 09, 2023
Official Matplotlib cheat sheets

Official Matplotlib cheat sheets

Matplotlib Developers 6.7k Jan 09, 2023
Simple and fast histogramming in Python accelerated with OpenMP.

pygram11 Simple and fast histogramming in Python accelerated with OpenMP with help from pybind11. pygram11 provides functions for very fast histogram

Doug Davis 28 Dec 14, 2022
CLAHE Contrast Limited Adaptive Histogram Equalization

A simple code to process images using contrast limited adaptive histogram equalization. Image processing is becoming a major part of data processig.

Happy N. Monday 4 May 18, 2022
Keir&'s Visualizing Data on Life Expectancy

Keir's Visualizing Data on Life Expectancy Below is information on life expectancy in the United States from 1900-2017. You will also find information

9 Jun 06, 2022
A deceptively simple plotting library for Streamlit

🍅 Plost A deceptively simple plotting library for Streamlit. Because you've been writing plots wrong all this time. Getting started pip install plost

Thiago Teixeira 192 Dec 29, 2022
OpenStats is a library built on top of streamlit that extracts data from the Github API and shows the main KPIs

Open Stats Discover and share the KPIs of your OpenSource project. OpenStats is a library built on top of streamlit that extracts data from the Github

Pere Miquel Brull 4 Apr 03, 2022
Function Plotter: a simple application with GUI to plot mathematical functions

Function-Plotter Function Plotter is a simple application with GUI to plot mathe

Mohamed Nabawe 4 Jan 03, 2022
:small_red_triangle: Ternary plotting library for python with matplotlib

python-ternary This is a plotting library for use with matplotlib to make ternary plots plots in the two dimensional simplex projected onto a two dime

Marc 611 Dec 29, 2022
A set of useful perceptually uniform colormaps for plotting scientific data

Colorcet: Collection of perceptually uniform colormaps Build Status Coverage Latest dev release Latest release Docs What is it? Colorcet is a collecti

HoloViz 590 Dec 31, 2022
Multi-class confusion matrix library in Python

Table of contents Overview Installation Usage Document Try PyCM in Your Browser Issues & Bug Reports Todo Outputs Dependencies Contribution References

Sepand Haghighi 1.3k Dec 31, 2022