A simple agent-based model used to teach the basics of OOP in my lectures

Overview

Pydemic

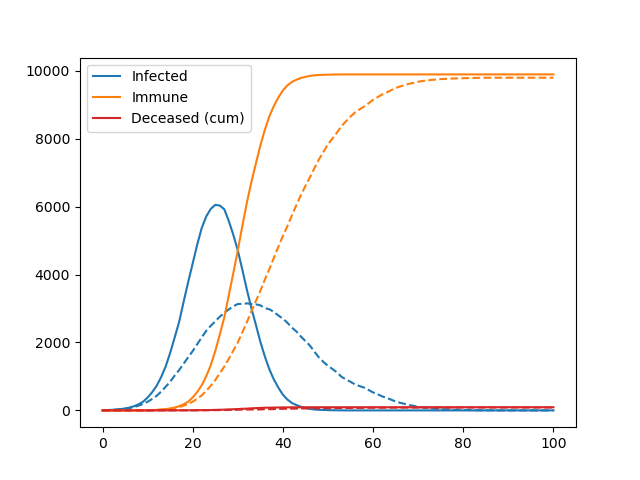
A simple agent-based model of a pandemic.

This is used to teach basic principles of object-oriented programming to master students.

It is not at all optimized for performance and does not have any predictive skill.

Based on an original idea by Georg Wohlfahrt.

image

Rules

We are simulating a square 2-dimensional (nx x nx pixel) domain which is populated by a maximum number of agents (na), i.e. human individuals. The initial position of the agents on the domain is determined with a pseudo-random number generator. Two or more agents may populate the same pixel.

The simulation runs to a maximum of nt time steps. During every time step each agent may move a maximum number of pixels in the horizontal (x) and vertical (y) direction, as determined by the movemax parameter. If movemax = 2, this means that agents may move between -2 and +2 pixels in the x/y-direction – the actual number of moves within these limits is again determined with the random number generator.

If the random moves would cause an agent to leave the domain, the agent is perfectly “reflected” into the domain, i.e. if a random move would bring an agent to the position nx + 2, the position is corrected to nx – 2.

At the start of the simulation, a number n_initial_infected of randomly selected agents carries the virus.

If two or more agents meet on the same pixel and at least one of them is infected there is a certain probability (probability_of_infection) that non-infected, non-immune agents become infected. This dice roll is repeated for each infected agent at this location.

If infected, agents remain infectious until they recover (time_until_recovery). At the end of the infection period, there is also some probability that agents do not recover, but instead decease (mortality_rate), which reduces the total number of agents on the domain. After recovery, the past infection conveys immunity from another infection.

Potential improvements

There are many. See exercises on the topic.

Getting started

Download the code and run pydemic.py in the terminal or in the ipython interpreter.

TODO Fabien

  • Write tests.
  • Add a visualisation of the spatial domain (with density plots or similar).
Owner
Fabien Maussion
Climate, glaciers, and programming.
Fabien Maussion
Active Transport Analytics Model (ATAM) is a new strategic transport modelling and data visualization framework for Active Transport as well as emerging micro-mobility modes

{ATAM} Active Transport Analytics Model Active Transport Analytics Model (“ATAM”) is a new strategic transport modelling and data visualization framew

Peter Stephan 0 Jan 12, 2022
Automatically Visualize any dataset, any size with a single line of code. Created by Ram Seshadri. Collaborators Welcome. Permission Granted upon Request.

AutoViz Automatically Visualize any dataset, any size with a single line of code. AutoViz performs automatic visualization of any dataset with one lin

AutoViz and Auto_ViML 1k Jan 02, 2023
A command line tool for visualizing CSV/spreadsheet-like data

PerfPlotter Read data from CSV files using pandas and generate interactive plots using bokeh, which can then be embedded into HTML pages and served by

Gino Mempin 0 Jun 25, 2022
CLAHE Contrast Limited Adaptive Histogram Equalization

A simple code to process images using contrast limited adaptive histogram equalization. Image processing is becoming a major part of data processig.

Happy N. Monday 4 May 18, 2022
termplotlib is a Python library for all your terminal plotting needs.

termplotlib termplotlib is a Python library for all your terminal plotting needs. It aims to work like matplotlib. Line plots For line plots, termplot

Nico Schlömer 553 Dec 30, 2022
📊 Extensions for Matplotlib

📊 Extensions for Matplotlib

Nico Schlömer 519 Dec 30, 2022
Drug design and development team HackBio internship is a virtual bioinformatics program that introduces students and professional to advanced practical bioinformatics and its applications globally.

-Nyokong. Drug design and development team HackBio internship is a virtual bioinformatics program that introduces students and professional to advance

4 Aug 04, 2022
Flexitext is a Python library that makes it easier to draw text with multiple styles in Matplotlib

Flexitext is a Python library that makes it easier to draw text with multiple styles in Matplotlib

Tomás Capretto 93 Dec 28, 2022
Custom Plotly Dash components based on Mantine React Components library

Dash Mantine Components Dash Mantine Components is a Dash component library based on Mantine React Components Library. It makes it easier to create go

Snehil Vijay 239 Jan 08, 2023
CompleX Group Interactions (XGI) provides an ecosystem for the analysis and representation of complex systems with group interactions.

XGI CompleX Group Interactions (XGI) is a Python package for the representation, manipulation, and study of the structure, dynamics, and functions of

Complex Group Interactions 67 Dec 28, 2022
China and India Population and GDP Visualization

China and India Population and GDP Visualization Historical Population Comparison between India and China This graph shows the population data of Indi

Nicolas De Mello 10 Oct 27, 2021
ICS-Visualizer is an interactive Industrial Control Systems (ICS) network graph that contains up-to-date ICS metadata

ICS-Visualizer is an interactive Industrial Control Systems (ICS) network graph that contains up-to-date ICS metadata (Name, company, port, user manua

QeeqBox 2 Dec 13, 2021
Investment and risk technologies maintained by Fortitudo Technologies.

Fortitudo Technologies Open Source This package allows you to freely explore open-source implementations of some of our fundamental technologies under

Fortitudo Technologies 11 Dec 14, 2022
A python visualization of the A* path finding algorithm

A python visualization of the A* path finding algorithm. It allows you to pick your start, end location and make obstacles and then view the process of finding the shortest path. You can also choose

Kimeon 4 Aug 02, 2022
Using SQLite within Python to create database and analyze Starcraft 2 units data (Pandas also used)

SQLite python Starcraft 2 English This project shows the usage of SQLite with python. To create, modify and communicate with the SQLite database from

1 Dec 30, 2021
An open-source plotting library for statistical data.

Lets-Plot Lets-Plot is an open-source plotting library for statistical data. It is implemented using the Kotlin programming language. The design of Le

JetBrains 820 Jan 06, 2023
Make your BSC transaction simple.

bsc_trade_history Make your BSC transaction simple. 中文ReadMe Background: inspired by debank ,Practice my hands on this small project Blog:Crypto-BscTr

foolisheddy 7 Jul 06, 2022
VDLdraw - Batch plot the log files exported from VisualDL using Matplotlib

VDLdraw Batch plot the log files exported from VisualDL using Matplotlib. At pre

Yizhou Chen 5 Sep 26, 2022
A simple python script using Numpy and Matplotlib library to plot a Mohr's Circle when given a two-dimensional state of stress.

Mohr's Circle Calculator This is a really small personal project done for Department of Civil Engineering, Delhi Technological University (formerly, D

Agyeya Mishra 0 Jul 17, 2021
🎨 Python3 binding for `@AntV/G2Plot` Plotting Library .

PyG2Plot 🎨 Python3 binding for @AntV/G2Plot which an interactive and responsive charting library. Based on the grammar of graphics, you can easily ma

hustcc 990 Jan 05, 2023