LabGraph is a a Python-first framework used to build sophisticated research systems with real-time streaming, graph API, and parallelism.

Overview

labgraph-interactive

LabGraph Interactive

Learning LabGraph online.

What is LabGraph?

LabGraph is a a Python-first framework used to build sophisticated research systems with real-time streaming, graph API, and parallelism. Facebook Researchers use it prototype wearable hardware systems and process digital signals under their VR/AR efforts into the Metaverse.

To put it simply, LabGraph sets the relationship between the inputs and outputs of computations and provides the needed tooling to run them in parallel to help developers focus on algorithms instead of the environment.

What is LabGraph Interactive?

As MLH Fellows who have not used LabGraph before, we had a hard time understanding its purpose, how to set it up correctly, and what to expect from the library. So we decided to help future MLH Fellows get up to speed both on concepts and usage with an interactive tool.

We built the interactive tool to let users get the taste of LabGraph with zero commitments. The interactive terminal lets the users run simulations we prepared with different numbers of features and see their expected outputs.

How to Use LabGraph Interactive?

  1. Navigate to the website hosted on GitHub Pages at mlh-fellowship.github.io/labgraph-interactive
  2. Type help into the terminal
  3. Run the commands you would like to try out
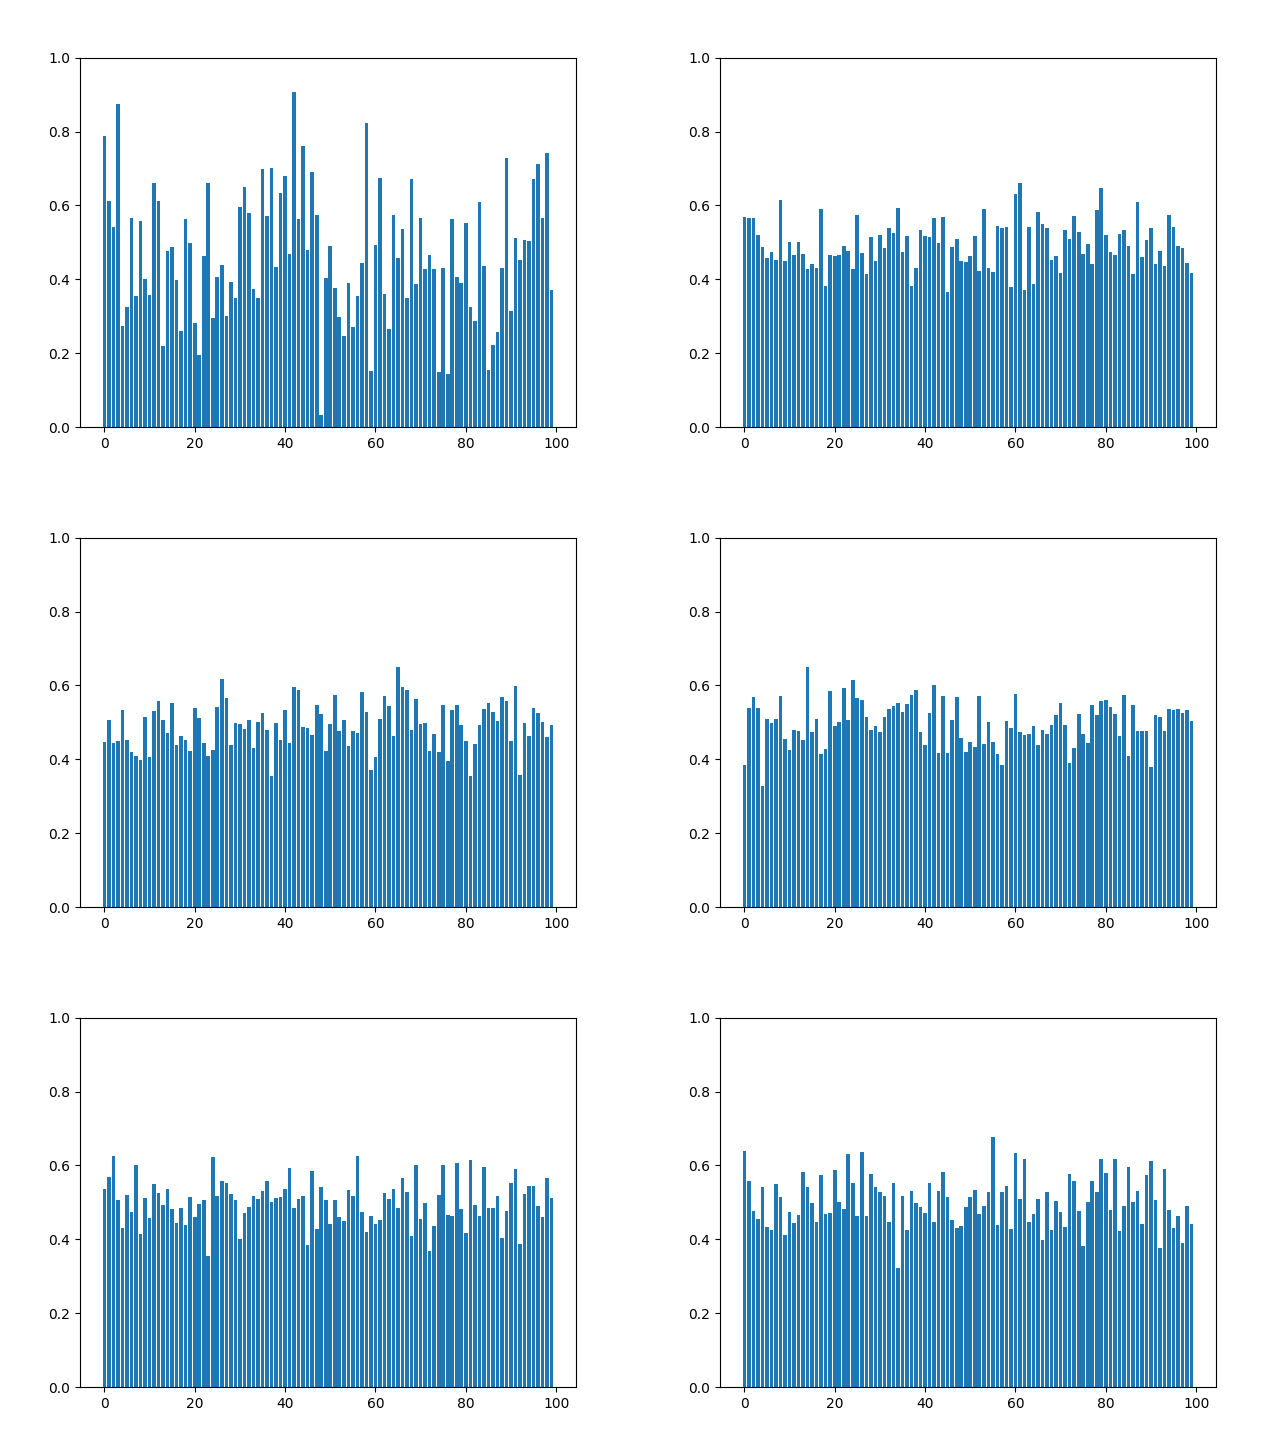
  4. Check the resulted graph built with random data

How to Use LabGraph?

To run LabGraph simulations on your machine, follow steps listed below:

  1. Run pip install labgraph to install LabGraph along with its dependecieis
  2. Run python setup.py install to work with the simulation we prepared and listed under random_labgraph/simulation.py
  3. Run python random_labgraph/simulation.py 100 to get a graph produced with LabGraph's node in real-time

License

This project is served unded the MIT License.

MIT License

Copyright (c) 2022 MLH Fellowship

Permission is hereby granted, free of charge, to any person obtaining a copy
of this software and associated documentation files (the "Software"), to deal
in the Software without restriction, including without limitation the rights
to use, copy, modify, merge, publish, distribute, sublicense, and/or sell
copies of the Software, and to permit persons to whom the Software is
furnished to do so, subject to the following conditions:

The above copyright notice and this permission notice shall be included in all
copies or substantial portions of the Software.

THE SOFTWARE IS PROVIDED "AS IS", WITHOUT WARRANTY OF ANY KIND, EXPRESS OR
IMPLIED, INCLUDING BUT NOT LIMITED TO THE WARRANTIES OF MERCHANTABILITY,
FITNESS FOR A PARTICULAR PURPOSE AND NONINFRINGEMENT. IN NO EVENT SHALL THE
AUTHORS OR COPYRIGHT HOLDERS BE LIABLE FOR ANY CLAIM, DAMAGES OR OTHER
LIABILITY, WHETHER IN AN ACTION OF CONTRACT, TORT OR OTHERWISE, ARISING FROM,
OUT OF OR IN CONNECTION WITH THE SOFTWARE OR THE USE OR OTHER DEALINGS IN THE
SOFTWARE.
Owner
MLH Fellowship
An internship alternative for software engineers, by Major League Hacking
MLH Fellowship
Interactive plotting for Pandas using Vega-Lite

pdvega: Vega-Lite plotting for Pandas Dataframes pdvega is a library that allows you to quickly create interactive Vega-Lite plots from Pandas datafra

Altair 342 Oct 26, 2022
Small project to recursively calculate and plot each successive order of the Hilbert Curve

hilbert-curve Small project to recursively calculate and plot each successive order of the Hilbert Curve. After watching 3Blue1Brown's video on Hilber

Stefan Mejlgaard 2 Nov 15, 2021
Python package for hypergraph analysis and visualization.

The HyperNetX library provides classes and methods for the analysis and visualization of complex network data. HyperNetX uses data structures designed to represent set systems containing nested data

Pacific Northwest National Laboratory 304 Dec 27, 2022
2D maze path solver visualizer implemented with python

2D maze path solver visualizer implemented with python

SS 14 Dec 21, 2022
This is a web application to visualize various famous technical indicators and stocks tickers from user

Visualizing Technical Indicators Using Python and Plotly. Currently facing issues hosting the application on heroku. As soon as I am able to I'll like

4 Aug 04, 2022
Ana's Portfolio

Ana's Portfolio ✌️ Welcome to my Portfolio! You will find here different Projects I have worked on (from scratch) 💪 Projects 💻 1️⃣ Hangman game (Mad

Ana Katherine Cortes Sobrino 9 Mar 15, 2022
This GitHub Repository contains Data Analysis projects that I have completed so far! While most of th project are focused on Data Analysis, some of them are also put here to show off other skills that I have learned.

Welcome to my Data Analysis projects page! This GitHub Repository contains Data Analysis projects that I have completed so far! While most of th proje

Kyle Dini 1 Jan 31, 2022
Create a table with row explanations, column headers, using matplotlib

Create a table with row explanations, column headers, using matplotlib. Intended usage was a small table containing a custom heatmap.

4 Aug 14, 2022
WhatsApp Chat Analyzer is a WebApp and it can be used by anyone to analyze their chat. 😄

WhatsApp-Chat-Analyzer You can view the working project here. WhatsApp chat Analyzer is a WebApp where anyone either tech or non-tech person can analy

Prem Chandra Singh 26 Nov 02, 2022
Movie recommendation using RASA, TigerGraph

Demo run: The below video will highlight the runtime of this setup and some sample real-time conversations using the power of RASA + TigerGraph, Steps

Sudha Vijayakumar 3 Sep 10, 2022
Info for The Great DataTas plot-a-thon

The Great DataTas plot-a-thon Datatas is organising a Data Visualisation competition: The Great DataTas plot-a-thon We will be using Tidy Tuesday data

2 Nov 21, 2021
NumPy and Pandas interface to Big Data

Blaze translates a subset of modified NumPy and Pandas-like syntax to databases and other computing systems. Blaze allows Python users a familiar inte

Blaze 3.1k Jan 01, 2023
HW_02 Data visualisation task

HW_02 Data visualisation and Matplotlib practice Instructions for HW_02 Idea for data analysis As I was brainstorming ideas and running through databa

9 Dec 13, 2022
DALLE-tools provided useful dataset utilities to improve you workflow with WebDatasets.

DALLE tools DALLE-tools is a github repository with useful tools to categorize, annotate or check the sanity of your datasets. Installation Just clone

11 Dec 25, 2022
VDLdraw - Batch plot the log files exported from VisualDL using Matplotlib

VDLdraw Batch plot the log files exported from VisualDL using Matplotlib. At pre

Yizhou Chen 5 Sep 26, 2022
ipyvizzu - Jupyter notebook integration of Vizzu

ipyvizzu - Jupyter notebook integration of Vizzu. Tutorial · Examples · Repository About The Project ipyvizzu is the Jupyter Notebook integration of V

Vizzu 729 Jan 08, 2023
Visualizing weather changes across the world using third party APIs and Python.

WEATHER FORECASTING ACROSS THE WORLD Overview Python scripts were created to visualize the weather for over 500 cities across the world at varying di

G Johnson 0 Jun 12, 2021
Wikipedia WordCloud App generate Wikipedia word cloud art created using python's streamlit, matplotlib, wikipedia and wordcloud packages

Wikipedia WordCloud App Wikipedia WordCloud App generate Wikipedia word cloud art created using python's streamlit, matplotlib, wikipedia and wordclou

Siva Prakash 5 Jan 02, 2022
Standardized plots and visualizations in Python

Standardized plots and visualizations in Python pltviz is a Python package for standardized visualization. Routine and novel plotting approaches are f

Andrew Tavis McAllister 0 Jul 09, 2022
Data science project for exploratory analysis on the kcse grades dataset (Kamilimu Data Science Track)

Kcse-Data-Analysis Data science project for exploratory analysis on the kcse grades dataset (Kamilimu Data Science Track) Findings The performance of

MUGO BRIAN 1 Feb 23, 2022