Clustergram - Visualization and diagnostics for cluster analysis in Python

Overview

Clustergram

logo clustergram

Visualization and diagnostics for cluster analysis

DOI

Clustergram is a diagram proposed by Matthias Schonlau in his paper The clustergram: A graph for visualizing hierarchical and nonhierarchical cluster analyses.

In hierarchical cluster analysis, dendrograms are used to visualize how clusters are formed. I propose an alternative graph called a “clustergram” to examine how cluster members are assigned to clusters as the number of clusters increases. This graph is useful in exploratory analysis for nonhierarchical clustering algorithms such as k-means and for hierarchical cluster algorithms when the number of observations is large enough to make dendrograms impractical.

The clustergram was later implemented in R by Tal Galili, who also gives a thorough explanation of the concept.

This is a Python translation of Tal's script written for scikit-learn and RAPIDS cuML implementations of K-Means, Mini Batch K-Means and Gaussian Mixture Model (scikit-learn only) clustering, plus hierarchical/agglomerative clustering using SciPy. Alternatively, you can create clustergram using from_* constructors based on alternative clustering algorithms.

Getting started

You can install clustergram from conda or pip:

conda install clustergram -c conda-forge
pip install clustergram

In any case, you still need to install your selected backend (scikit-learn and scipy or cuML).

The example of clustergram on Palmer penguins dataset:

import seaborn
df = seaborn.load_dataset('penguins')

First we have to select numerical data and scale them.

from sklearn.preprocessing import scale
data = scale(df.drop(columns=['species', 'island', 'sex']).dropna())

And then we can simply pass the data to clustergram.

from clustergram import Clustergram

cgram = Clustergram(range(1, 8))
cgram.fit(data)
cgram.plot()

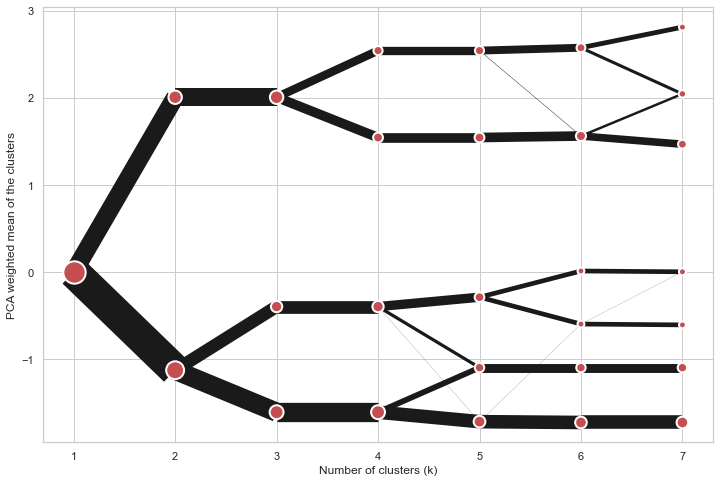
Default clustergram

Styling

Clustergram.plot() returns matplotlib axis and can be fully customised as any other matplotlib plot.

seaborn.set(style='whitegrid')

cgram.plot(
    ax=ax,
    size=0.5,
    linewidth=0.5,
    cluster_style={"color": "lightblue", "edgecolor": "black"},
    line_style={"color": "red", "linestyle": "-."},
    figsize=(12, 8)
)

Colored clustergram

Mean options

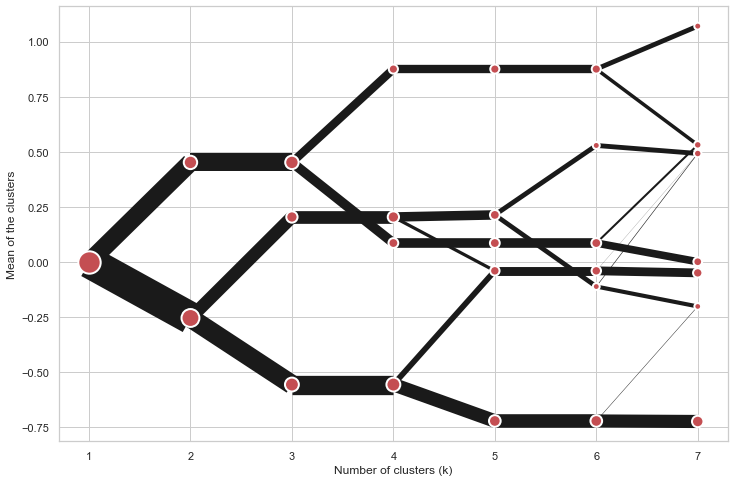
On the y axis, a clustergram can use mean values as in the original paper by Matthias Schonlau or PCA weighted mean values as in the implementation by Tal Galili.

cgram = Clustergram(range(1, 8))
cgram.fit(data)
cgram.plot(figsize=(12, 8), pca_weighted=True)

Default clustergram

cgram = Clustergram(range(1, 8))
cgram.fit(data)
cgram.plot(figsize=(12, 8), pca_weighted=False)

Default clustergram

Scikit-learn, SciPy and RAPIDS cuML backends

Clustergram offers three backends for the computation - scikit-learn and scipy which use CPU and RAPIDS.AI cuML, which uses GPU. Note that all are optional dependencies but you will need at least one of them to generate clustergram.

Using scikit-learn (default):

cgram = Clustergram(range(1, 8), backend='sklearn')
cgram.fit(data)
cgram.plot()

Using cuML:

cgram = Clustergram(range(1, 8), backend='cuML')
cgram.fit(data)
cgram.plot()

data can be all data types supported by the selected backend (including cudf.DataFrame with cuML backend).

Supported methods

Clustergram currently supports K-Means, Mini Batch K-Means, Gaussian Mixture Model and SciPy's hierarchical clustering methods. Note tha GMM and Mini Batch K-Means are supported only for scikit-learn backend and hierarchical methods are supported only for scipy backend.

Using K-Means (default):

cgram = Clustergram(range(1, 8), method='kmeans')
cgram.fit(data)
cgram.plot()

Using Mini Batch K-Means, which can provide significant speedup over K-Means:

cgram = Clustergram(range(1, 8), method='minibatchkmeans', batch_size=100)
cgram.fit(data)
cgram.plot()

Using Gaussian Mixture Model:

cgram = Clustergram(range(1, 8), method='gmm')
cgram.fit(data)
cgram.plot()

Using Ward's hierarchical clustering:

cgram = Clustergram(range(1, 8), method='hierarchical', linkage='ward')
cgram.fit(data)
cgram.plot()

Manual input

Alternatively, you can create clustergram using from_data or from_centers methods based on alternative clustering algorithms.

Using Clustergram.from_data which creates cluster centers as mean or median values:

data = numpy.array([[-1, -1, 0, 10], [1, 1, 10, 2], [0, 0, 20, 4]])
labels = pandas.DataFrame({1: [0, 0, 0], 2: [0, 0, 1], 3: [0, 2, 1]})

cgram = Clustergram.from_data(data, labels)
cgram.plot()

Using Clustergram.from_centers based on explicit cluster centers.:

labels = pandas.DataFrame({1: [0, 0, 0], 2: [0, 0, 1], 3: [0, 2, 1]})
centers = {
            1: np.array([[0, 0]]),
            2: np.array([[-1, -1], [1, 1]]),
            3: np.array([[-1, -1], [1, 1], [0, 0]]),
        }
cgram = Clustergram.from_centers(centers, labels)
cgram.plot(pca_weighted=False)

To support PCA weighted plots you also need to pass data:

cgram = Clustergram.from_centers(centers, labels, data=data)
cgram.plot()

Partial plot

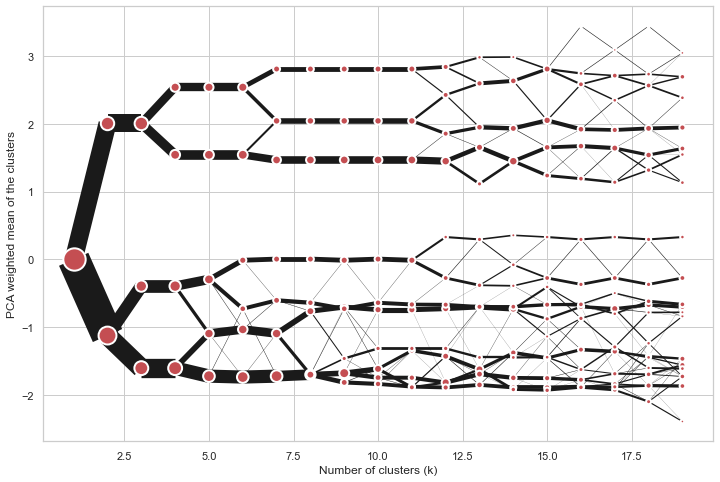
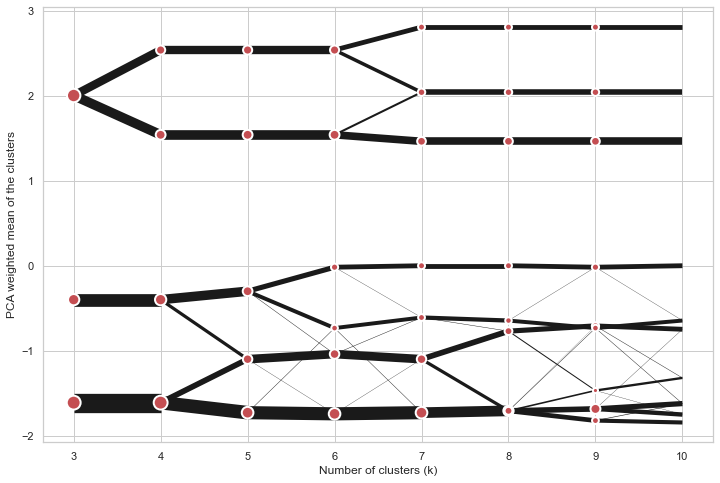
Clustergram.plot() can also plot only a part of the diagram, if you want to focus on a limited range of k.

cgram = Clustergram(range(1, 20))
cgram.fit(data)
cgram.plot(figsize=(12, 8))

Long clustergram

cgram.plot(k_range=range(3, 10), figsize=(12, 8))

Limited clustergram

Additional clustering performance evaluation

Clustergam includes handy wrappers around a selection of clustering performance metrics offered by scikit-learn. Data which were originally computed on GPU are converted to numpy on the fly.

Silhouette score

Compute the mean Silhouette Coefficient of all samples. See scikit-learn documentation for details.

>>> cgram.silhouette_score()
2    0.531540
3    0.447219
4    0.400154
5    0.377720
6    0.372128
7    0.331575
Name: silhouette_score, dtype: float64

Once computed, resulting Series is available as cgram.silhouette. Calling the original method will recompute the score.

Calinski and Harabasz score

Compute the Calinski and Harabasz score, also known as the Variance Ratio Criterion. See scikit-learn documentation for details.

>>> cgram.calinski_harabasz_score()
2    482.191469
3    441.677075
4    400.392131
5    411.175066
6    382.731416
7    352.447569
Name: calinski_harabasz_score, dtype: float64

Once computed, resulting Series is available as cgram.calinski_harabasz. Calling the original method will recompute the score.

Davies-Bouldin score

Compute the Davies-Bouldin score. See scikit-learn documentation for details.

>>> cgram.davies_bouldin_score()
2    0.714064
3    0.943553
4    0.943320
5    0.973248
6    0.950910
7    1.074937
Name: davies_bouldin_score, dtype: float64

Once computed, resulting Series is available as cgram.davies_bouldin. Calling the original method will recompute the score.

Acessing labels

Clustergram stores resulting labels for each of the tested options, which can be accessed as:

>>> cgram.labels
     1  2  3  4  5  6  7
0    0  0  2  2  3  2  1
1    0  0  2  2  3  2  1
2    0  0  2  2  3  2  1
3    0  0  2  2  3  2  1
4    0  0  2  2  0  0  3
..  .. .. .. .. .. .. ..
337  0  1  1  3  2  5  0
338  0  1  1  3  2  5  0
339  0  1  1  1  1  1  4
340  0  1  1  3  2  5  5
341  0  1  1  1  1  1  5

Saving clustergram

You can save both plot and clustergram.Clustergram to a disk.

Saving plot

Clustergram.plot() returns matplotlib axis object and as such can be saved as any other plot:

import matplotlib.pyplot as plt

cgram.plot()
plt.savefig('clustergram.svg')

Saving object

If you want to save your computed clustergram.Clustergram object to a disk, you can use pickle library:

import pickle

with open('clustergram.pickle','wb') as f:
    pickle.dump(cgram, f)

Then loading is equally simple:

with open('clustergram.pickle','rb') as f:
    loaded = pickle.load(f)

References

Schonlau M. The clustergram: a graph for visualizing hierarchical and non-hierarchical cluster analyses. The Stata Journal, 2002; 2 (4):391-402.

Schonlau M. Visualizing Hierarchical and Non-Hierarchical Cluster Analyses with Clustergrams. Computational Statistics: 2004; 19(1):95-111.

https://www.r-statistics.com/2010/06/clustergram-visualization-and-diagnostics-for-cluster-analysis-r-code/

Comments
  • ENH: support interactive bokeh plots

    ENH: support interactive bokeh plots

    Adds Clustergram.bokeh() method which generates clustergram in a form of internactive bokeh plot. On top of an ability to zoom to specific sections shows the count of observations and cluster label (linked to Clustergram.labels).

    To-do:

    • [ ] documentation
    • [x] check RAPIDS compatibility

    I think I'll need to split docs into muliple pages at this point.

    opened by martinfleis 1
  • ENH: from_data and from_centers methods

    ENH: from_data and from_centers methods

    Addind the ability to create clustergram using custom data, without the need to run any cluster algorithm within clustergram itself.

    from_data gets labels and data and creates cluster centers as mean or median values.

    from_centers utilises custom centers when mean/median is not the optimal solution (like in case of GMM for example).

    Closes #10

    opened by martinfleis 1
  • skip k=1 for K-Means

    skip k=1 for K-Means

    k=1 does not need to be modelled, cluster centre is a pure mean of an input array. All the other options require k=1 e.g to fit gaussian.

    Skip k=1 in all k-means implementations to get avoid unnecessary computation.

    opened by martinfleis 0
  • ENH: add bokeh plotting backend

    ENH: add bokeh plotting backend

    With some larger clustergrams it may be quite useful to have the ability to zoom to certain places interactively. I think that bokeh plotting backend would be good for that.

    opened by martinfleis 0
  • ENH: expose labels, refactor plot computation internals, add additional metrics

    ENH: expose labels, refactor plot computation internals, add additional metrics

    Closes #7

    This refactors internals a bit, which in turn allows exposing the actual clustering labels for each tested iteration.

    Aso adding a few additional methods to assess clustering performance on top of clustergram.

    opened by martinfleis 0
  • Support multiple PCAs

    Support multiple PCAs

    The current way of weighting by PCA is hard-coded to use the first one. But it could be useful to see clustergrams weighted by other PCAs as well.

    And it would be super cool to get a 3d version with the first component on one axis and a second one on the other (not sure how useful though :D).

    opened by martinfleis 0
  • Can this work with cluster made by top2vec ?

    Can this work with cluster made by top2vec ?

    Thanks for your interesting package.

    Do you think Clustergram could work with top2vec ? https://github.com/ddangelov/Top2Vec

    I saw that there is the option to create a clustergram from a DataFrame.

    In top2vec, each "document" to cluster is represented as a embedding of a certain dimension, 256 , for example.

    So I could indeed generate a data frame, like this:

    | x0 | x1| ... | x255 | topic | | -----|----|---- | -------| -- | | 0.5| 0.2 | ....| -0.2 | 2 | | 0.7| 0.2 | ....| -0.1 | 2 | | 0.5| 0.2 | ....| -0.2 | 3 |

    Does Clustergram assume anything on the rows of this data frame ? I saw that the from_data method either takes "mean" or "medium" as method to calculate the cluster centers.

    In word vector, we use typically the cosine distance to calculate distances between the vectors. Does this have any influence ?

    top2vec calculates as well the "topic vectors" as a mean of the "document vectors", I believe.

    opened by behrica 17
Releases(v0.6.0)
Owner
Martin Fleischmann
Researcher in geographic data science. Member of @geopandas and @pysal development teams.
Martin Fleischmann
Implementation of a Transformer that Ponders, using the scheme from the PonderNet paper

Ponder(ing) Transformer Implementation of a Transformer that learns to adapt the number of computational steps it takes depending on the difficulty of

Phil Wang 65 Oct 04, 2022
Code for Understanding Pooling in Graph Neural Networks

Select, Reduce, Connect This repository contains the code used for the experiments of: "Understanding Pooling in Graph Neural Networks" Setup Install

Daniele Grattarola 37 Dec 13, 2022
Accelerated NLP pipelines for fast inference on CPU and GPU. Built with Transformers, Optimum and ONNX Runtime.

Optimum Transformers Accelerated NLP pipelines for fast inference 🚀 on CPU and GPU. Built with 🤗 Transformers, Optimum and ONNX runtime. Installatio

Aleksey Korshuk 115 Dec 16, 2022
PyTorch implementation of Weak-shot Fine-grained Classification via Similarity Transfer

SimTrans-Weak-Shot-Classification This repository contains the official PyTorch implementation of the following paper: Weak-shot Fine-grained Classifi

BCMI 60 Dec 02, 2022
In this project, we create and implement a deep learning library from scratch.

ARA In this project, we create and implement a deep learning library from scratch. Table of Contents Deep Leaning Library Table of Contents About The

22 Aug 23, 2022
tsai is an open-source deep learning package built on top of Pytorch & fastai focused on state-of-the-art techniques for time series classification, regression and forecasting.

Time series Timeseries Deep Learning Pytorch fastai - State-of-the-art Deep Learning with Time Series and Sequences in Pytorch / fastai

timeseriesAI 2.8k Jan 08, 2023
DeepFill v1/v2 with Contextual Attention and Gated Convolution, CVPR 2018, and ICCV 2019 Oral

Generative Image Inpainting An open source framework for generative image inpainting task, with the support of Contextual Attention (CVPR 2018) and Ga

2.9k Dec 16, 2022
traiNNer is an open source image and video restoration (super-resolution, denoising, deblurring and others) and image to image translation toolbox based on PyTorch.

traiNNer traiNNer is an open source image and video restoration (super-resolution, denoising, deblurring and others) and image to image translation to

202 Jan 04, 2023
Machine Learning Platform for Kubernetes

Reproduce, Automate, Scale your data science. Welcome to Polyaxon, a platform for building, training, and monitoring large scale deep learning applica

polyaxon 3.2k Dec 23, 2022
MediaPipeのPythonパッケージのサンプルです。2020/12/11時点でPython実装のある4機能(Hands、Pose、Face Mesh、Holistic)について用意しています。

mediapipe-python-sample MediaPipeのPythonパッケージのサンプルです。 2020/12/11時点でPython実装のある以下4機能について用意しています。 Hands Pose Face Mesh Holistic Requirement mediapipe 0.

KazuhitoTakahashi 217 Dec 12, 2022
This repository provides the code for MedViLL(Medical Vision Language Learner).

MedViLL This repository provides the code for MedViLL(Medical Vision Language Learner). Our proposed architecture MedViLL is a single BERT-based model

SuperSuperMoon 39 Jan 05, 2023
Permute Me Softly: Learning Soft Permutations for Graph Representations

Permute Me Softly: Learning Soft Permutations for Graph Representations

Giannis Nikolentzos 7 Jul 10, 2022
Convolutional neural network web app trained to track our infant’s sleep schedule using our Google Nest camera.

Machine Learning Sleep Schedule Tracker What is it? Convolutional neural network web app trained to track our infant’s sleep schedule using our Google

g-parki 7 Jul 15, 2022
基于YoloX目标检测+DeepSort算法实现多目标追踪Baseline

项目简介: 使用YOLOX+Deepsort实现车辆行人追踪和计数,代码封装成一个Detector类,更容易嵌入到自己的项目中。 代码地址(欢迎star): https://github.com/Sharpiless/yolox-deepsort/ 最终效果: 运行demo: python demo

114 Dec 30, 2022
My take on a practical implementation of Linformer for Pytorch.

Linformer Pytorch Implementation A practical implementation of the Linformer paper. This is attention with only linear complexity in n, allowing for v

Peter 349 Dec 25, 2022
Improving Object Detection by Estimating Bounding Box Quality Accurately

Improving Object Detection by Estimating Bounding Box Quality Accurately Abstrac

2 Apr 14, 2022
A object detecting neural network powered by the yolo architecture and leveraging the PyTorch framework and associated libraries.

Yolo-Powered-Detector A object detecting neural network powered by the yolo architecture and leveraging the PyTorch framework and associated libraries

Luke Wilson 1 Dec 03, 2021
[NIPS 2021] UOTA: Improving Self-supervised Learning with Automated Unsupervised Outlier Arbitration.

UOTA: Improving Self-supervised Learning with Automated Unsupervised Outlier Arbitration This repository is the official PyTorch implementation of UOT

6 Jun 29, 2022
Official implementation of Protected Attribute Suppression System, ICCV 2021

Official implementation of Protected Attribute Suppression System, ICCV 2021

Prithviraj Dhar 6 Jan 01, 2023
Complementary Patch for Weakly Supervised Semantic Segmentation, ICCV21 (poster)

CPN (ICCV2021) This is an implementation of Complementary Patch for Weakly Supervised Semantic Segmentation, which is accepted by ICCV2021 poster. Thi

Ferenas 20 Dec 12, 2022