Sentiment Analysis application created with Python and Dash, hosted at socialsentiment.net

Overview

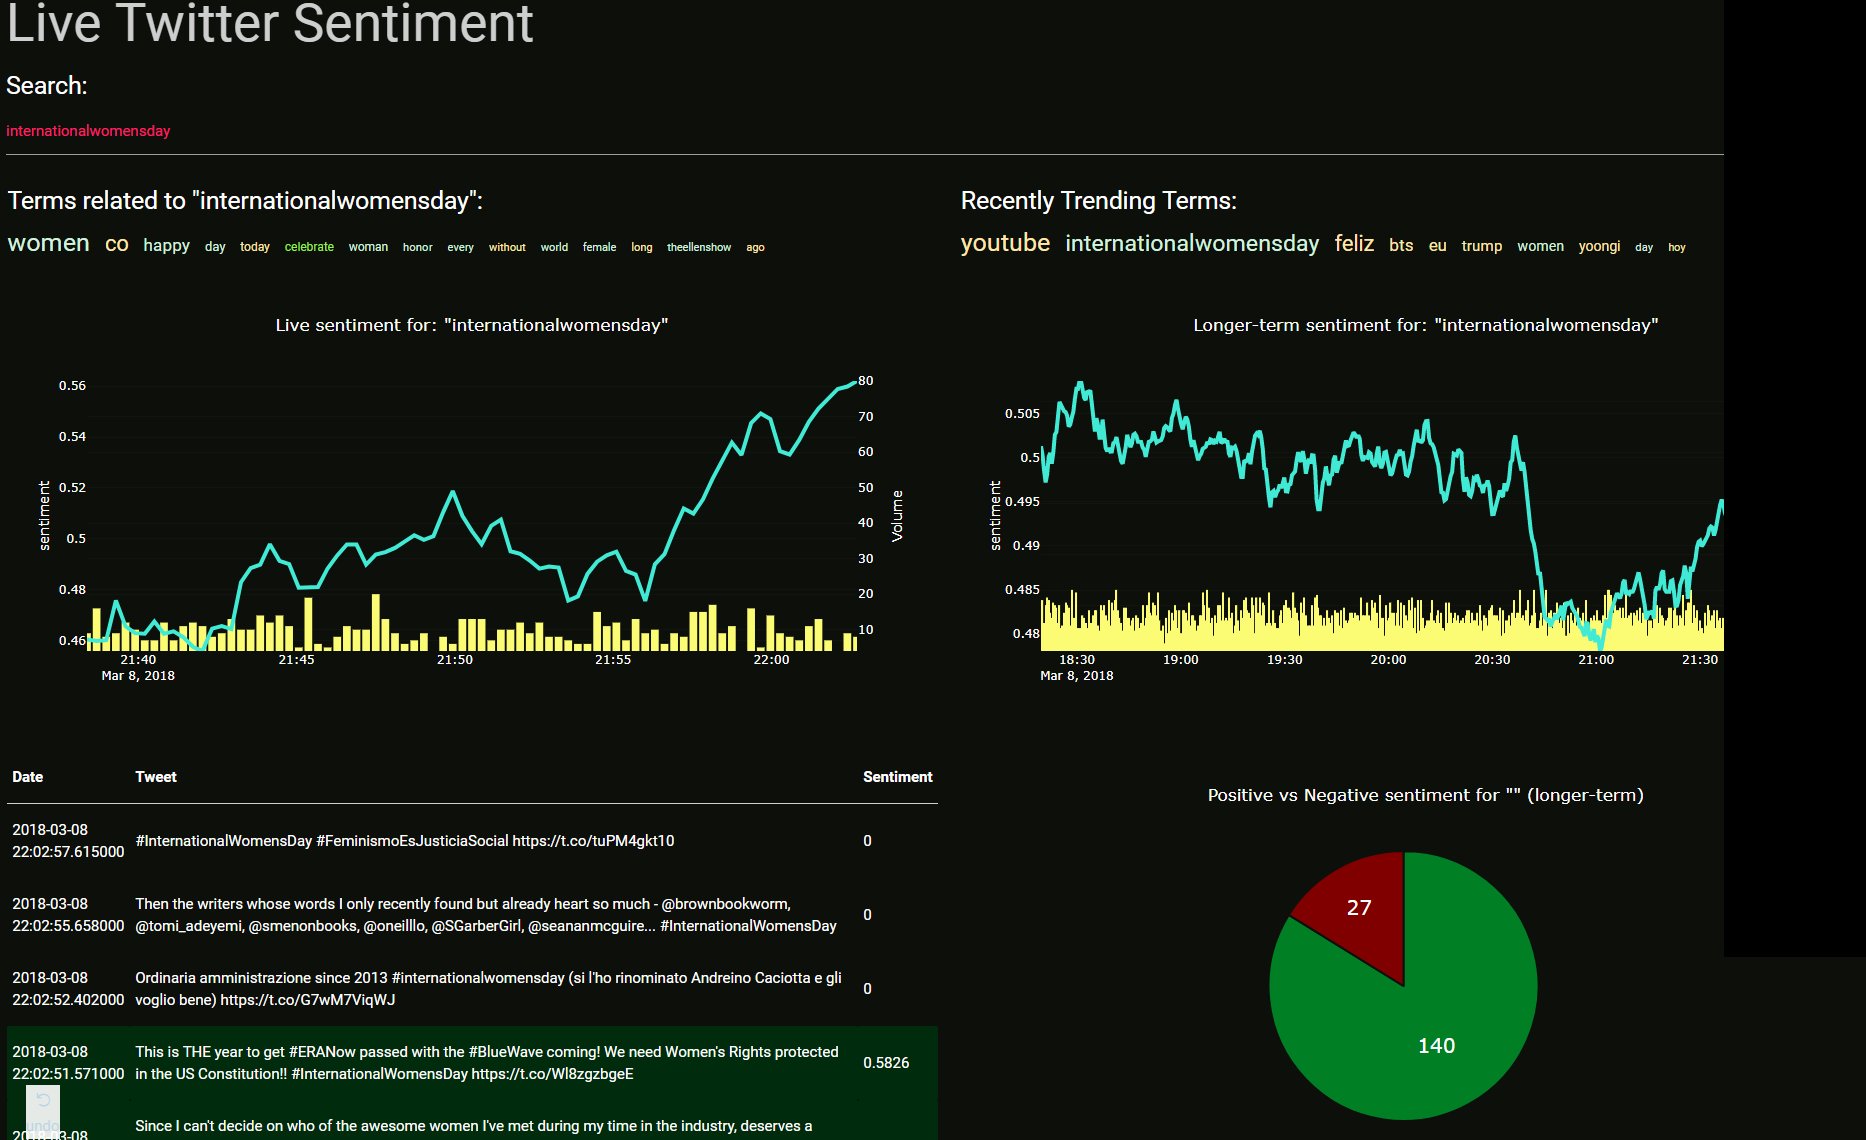
Social Sentiment Dash Application

Live-streaming sentiment analysis application created with Python and Dash, hosted at SocialSentiment.net.

application example

Dash Tutorials

This application was created in conjunction with the Dash tutorial series.

Repo Contents:

  • dash_mess.py - This is currently the main front-end application code. Contains the dash application layouts, logic for graphs, interfaces with the database...etc. Name is descriptive of the overall state of code :) ...this code is setup to run on a flask instance. If you want to clone this and run it locally, you will be using the dev_server.py
  • dev_server.py - If you wish to run this application locally, on the dev server, run via this instead.
  • twitter_stream.py - This should run in the background of your application. This is what streams tweets from Twitter, storing them into the sqlite database, which is what the dash_mess.py file interfaces with.
  • config.py - Meant for many configurations, but right now it just contains stop words. Words we don't intend to ever count in the "trending"
  • cache.py - For caching purposes in effort to get things to run faster.
  • db-truncate.py - A script to truncate the infinitely-growing sqlite database. You will get about 3.5 millionish tweets per day, depending on how fast you can process. You can keep these, but, as the database grows, search times will dramatically suffer.

Quick start

  • Clone repo
  • install requirements.txt using pip install -r requirements.txt
  • Fill in your Twitter App credentials to twitter_stream.py. Go to apps.twitter.com to set that up if you need to.
  • Run twitter_stream.py to build database
  • If you're using this locally, you can run the application with the dev_server.py script. If you want to deploy this to a webserver, see my deploying Dash application tutorial
  • You might need the latest version of sqlite.
sudo add-apt-repository ppa:jonathonf/backports
sudo apt-get update && sudo apt-get install sqlite3
  • Consider running the db-truncate.py from time to time (or via a cronjob), to keep the database reasonably sized. In its current state, the database really doesn't need to store more than 2-3 days of data most likely.

Tips for Running on Server

  • You can use Gunicorn to run the server
gunicorn dash_mess:server -b 0.0.0.0:80 -w 4

Todo

Want to help contribute???

  • Code is ugly. Low hanging fruit is just making the code not so ugly. Up to this point, I've just been in "make it work" mode.
  • App is ugly. I am not a designer. This app is prettttttyyyyyy gross. Think you have a better design? Halp.
  • Click-able related terms and trending terms would be nice. I tried, but failed at this. It'd be cool to see a related term, and be able to just click on it, and this becomes the new searched term, for example.
  • The interactive search is cool, but also does a search in the database per-character. It would be nice if it didn't search per key-press. Not sure I want a search button, I like the streamlined interactivity, but maybe wait 0.2 seconds or something without any new keypresses to perform the search? Something like that might help with speeds. I really do not know the best option here, I just know this isn't idea.
  • Other manipulations or ideas for interactivity? Feel free to show them in a PR.

Credits

The speed of the application, especially with a database with 10's of millions of records is thanks entirely to Daniel Kukiela who helped us to convert from regular sqlite to using fts, helping with the queries, new database structure, caching, and more.

Owner
Harrison
Harrison
paintable GitHub contribute table

githeart paintable github contribute table how to use: Functions key color select 1,2,3,4,5 clear c drawing mode mode on turn off e print paint matrix

Bahadır Araz 27 Nov 24, 2022
Draw interactive NetworkX graphs with Altair

nx_altair Draw NetworkX graphs with Altair nx_altair offers a similar draw API to NetworkX but returns Altair Charts instead. If you'd like to contrib

Zachary Sailer 206 Dec 12, 2022
Glue is a python project to link visualizations of scientific datasets across many files.

Glue Glue is a python project to link visualizations of scientific datasets across many files. Click on the image for a quick demo: Features Interacti

675 Dec 09, 2022
Fast visualization of radar_scenes based on oleschum/radar_scenes

RadarScenes Tools About This python package provides fast visualization for the RadarScenes dataset. The Open GL based visualizer is smoother than ole

Henrik Söderlund 2 Dec 09, 2021
A Python library created to assist programmers with complex mathematical functions

libmaths was created not only as a learning experience for me, but as a way to make mathematical models in seconds for Python users using mat

Simple 73 Oct 02, 2022
A simple Monte Carlo simulation using Python and matplotlib library

Monte Carlo python simulation Install linux dependencies sudo apt update sudo apt install build-essential \ software-properties-commo

Samuel Terra 2 Dec 13, 2021
Simple plotting for Python. Python wrapper for D3xter - render charts in the browser with simple Python syntax.

PyDexter Simple plotting for Python. Python wrapper for D3xter - render charts in the browser with simple Python syntax. Setup $ pip install PyDexter

D3xter 31 Mar 06, 2021
This is a Boids Simulation, written in Python with Pygame.

PyNBoids A Python Boids Simulation This is a Boids simulation, written in Python3, with Pygame2 and NumPy. To use: Save the pynboids_sp.py file (and n

Nik 17 Dec 18, 2022
Plotting library for IPython/Jupyter notebooks

bqplot 2-D plotting library for Project Jupyter Introduction bqplot is a 2-D visualization system for Jupyter, based on the constructs of the Grammar

3.4k Dec 29, 2022
1900-2016 Olympic Data Analysis in Python by plotting different graphs

🔥 Olympics Data Analysis 🔥 In Data Science field, there is a big topic before creating a model for future prediction is Data Analysis. We can find o

Sayan Roy 1 Feb 06, 2022
Data aggregated from the reports found at the MCPS COVID Dashboard into a set of visualizations.

Montgomery County Public Schools COVID-19 Visualizer Contents About this project Data Support this project About this project Data All data we use can

James 3 Jan 19, 2022
Attractors is a package for simulation and visualization of strange attractors.

attractors Attractors is a package for simulation and visualization of strange attractors. Installation The simplest way to install the module is via

Vignesh M 45 Jul 31, 2022
A set of useful perceptually uniform colormaps for plotting scientific data

Colorcet: Collection of perceptually uniform colormaps Build Status Coverage Latest dev release Latest release Docs What is it? Colorcet is a collecti

HoloViz 590 Dec 31, 2022
股票行情实时数据接口-A股,完全免费的沪深证券股票数据-中国股市,python最简封装的API接口

股票行情实时数据接口-A股,完全免费的沪深证券股票数据-中国股市,python最简封装的API接口,包含日线,历史K线,分时线,分钟线,全部实时采集,系统包括新浪腾讯双数据核心采集获取,自动故障切换,STOCK数据格式成DataFrame格式,可用来查询研究量化分析,股票程序自动化交易系统.为量化研究者在数据获取方面极大地减轻工作量,更加专注于策略和模型的研究与实现。

dev 572 Jan 08, 2023
Generate graphs with NetworkX, natively visualize with D3.js and pywebview

webview_d3 This is some PoC code to render graphs created with NetworkX natively using D3.js and pywebview. The main benifit of this approac

byt3bl33d3r 68 Aug 18, 2022
view cool stats related to your discord account.

DiscoStats cool statistics generated using your discord data. How? DiscoStats is not a service that breaks the Discord Terms of Service or Community G

ibrahim hisham 5 Jun 02, 2022
Arras.io Highest Scores Over Time Bar Chart Race

Arras.io Highest Scores Over Time Bar Chart Race This repo contains a python script (make_racing_bar_chart.py) that can generate a csv file which can

Road 2 Jan 16, 2022
A curated list of awesome Dash (plotly) resources

Awesome Dash A curated list of awesome Dash (plotly) resources Dash is a productive Python framework for building web applications. Written on top of

Luke Singham 1.7k Dec 26, 2022
A python package for animating plots build on matplotlib.

animatplot A python package for making interactive as well as animated plots with matplotlib. Requires Python = 3.5 Matplotlib = 2.2 (because slider

Tyler Makaro 394 Dec 18, 2022
Define fortify and autoplot functions to allow ggplot2 to handle some popular R packages.

ggfortify This package offers fortify and autoplot functions to allow automatic ggplot2 to visualize statistical result of popular R packages. Check o

Sinhrks 504 Dec 23, 2022