Resources for teaching & learning practical data visualization with python.

Overview

Practical Data Visualization with Python

Overview

All views expressed on this site are my own and do not represent the opinions of any entity with which I have been, am now, or will be affiliated.

This repository contains all materials related to a lecture / seminar I teach on practical data visualization with python. What I mean by "practical" is that the materials herein do not focus on one particular library or data visualization method; rather, my goal is to empower the consumer of this content with the tools, heuristics, and methods needed to handle a wide variety of data visualization problems.

If you have questions, comments, or suggested alterations to these materials, please open an issue here on GitHub. Also, don't hesitate to reach out via LinkedIn.

Outline of Materials

Below you'll find a brief outline of the content contained in the four sections of this seminar, along with notebook links, and an example visualization from each section. For each section there is a separate notebook of python code containing all the materials for that section. Each notebook will start with a few setup steps--package imports and data prep mostly--that are almost identical between the notebooks, directly after which comes the content for each section. For information about the data used in these materials, check out the data_prep_nb.ipynb notebook, the easy-to-view version of which is hosted here.

Section 1: Why We Visualize

Here is the link to the easy-to-view notebook for this section of material.
Here is the link to the GitHub-hosted notebook for this section of the material.

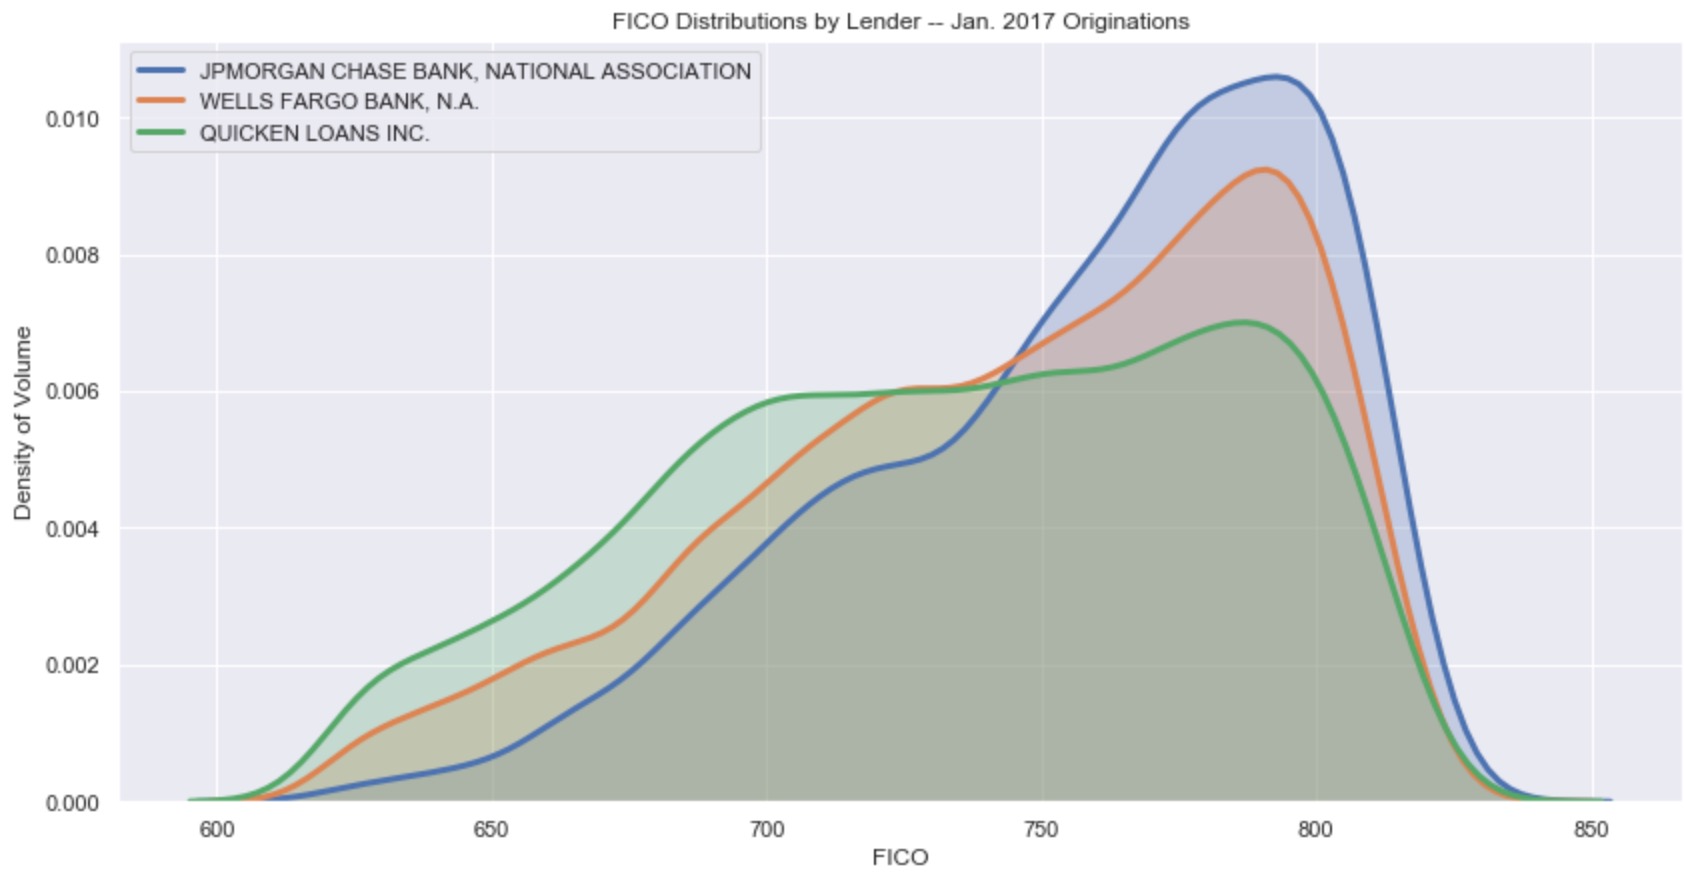
  1. The power of visual data representation and storytelling.
  2. A few principles and heuristics of visualization.
  3. The building blocks of visualization explored.

Example Visualization from this Section:

Section 2: Overview of Python Visualization Landscape

Here is the link to the easy-to-view notebook for this section of material.
Here is the link to the GitHub-hosted notebook for this section of the material.

  1. Intro to the visualization ecosystem: python's Tower of Babel.
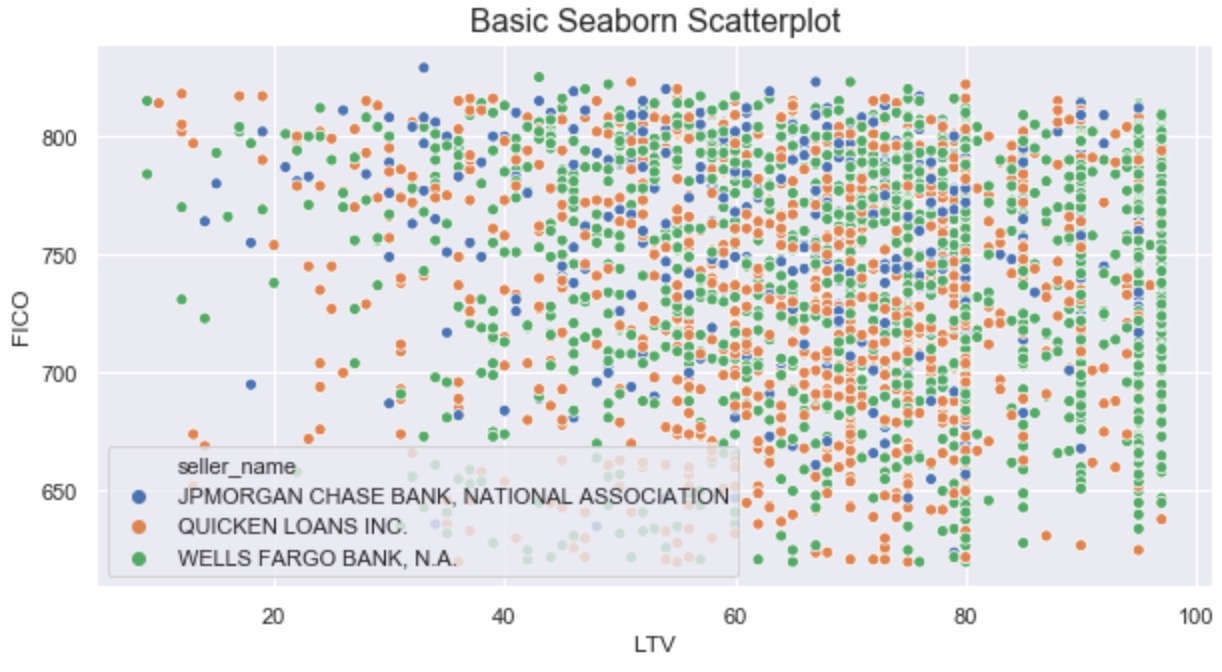
  2. Smorgasbord of packages explored through a single example viz.
  3. Quick & dirty (and subjective) heuristics for picking a visualization package.

Example Visualization from this Section:

Section 3: Statistical Visualization in the Wild

Here is the link to the easy-to-view notebook for this section of material.
Here is the link to the GitHub-hosted notebook for this section of the material.

  1. Example business use case of data visualization:
    1. Observational:
      • mean, median, and variance
      • distributions
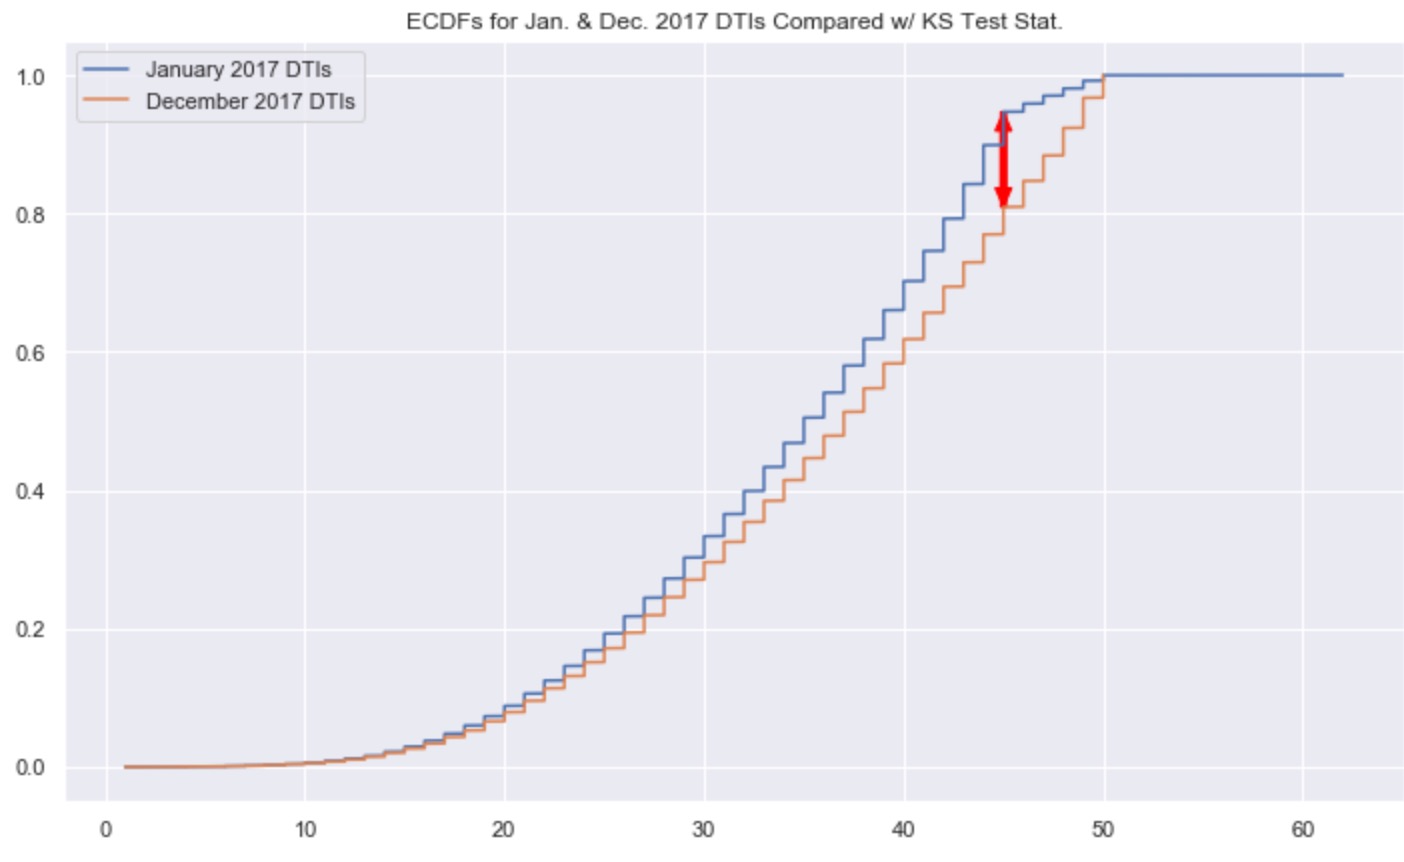
    2. Inferential:
      • parametric tests
      • non-parametric tests

Example Visualization from this Section:

Section 4: Library Deep-Dive (Plotly)

Here is the link to the easy-to-view notebook for this section of material.
Here is the link to the GitHub-hosted notebook for this section of the material.

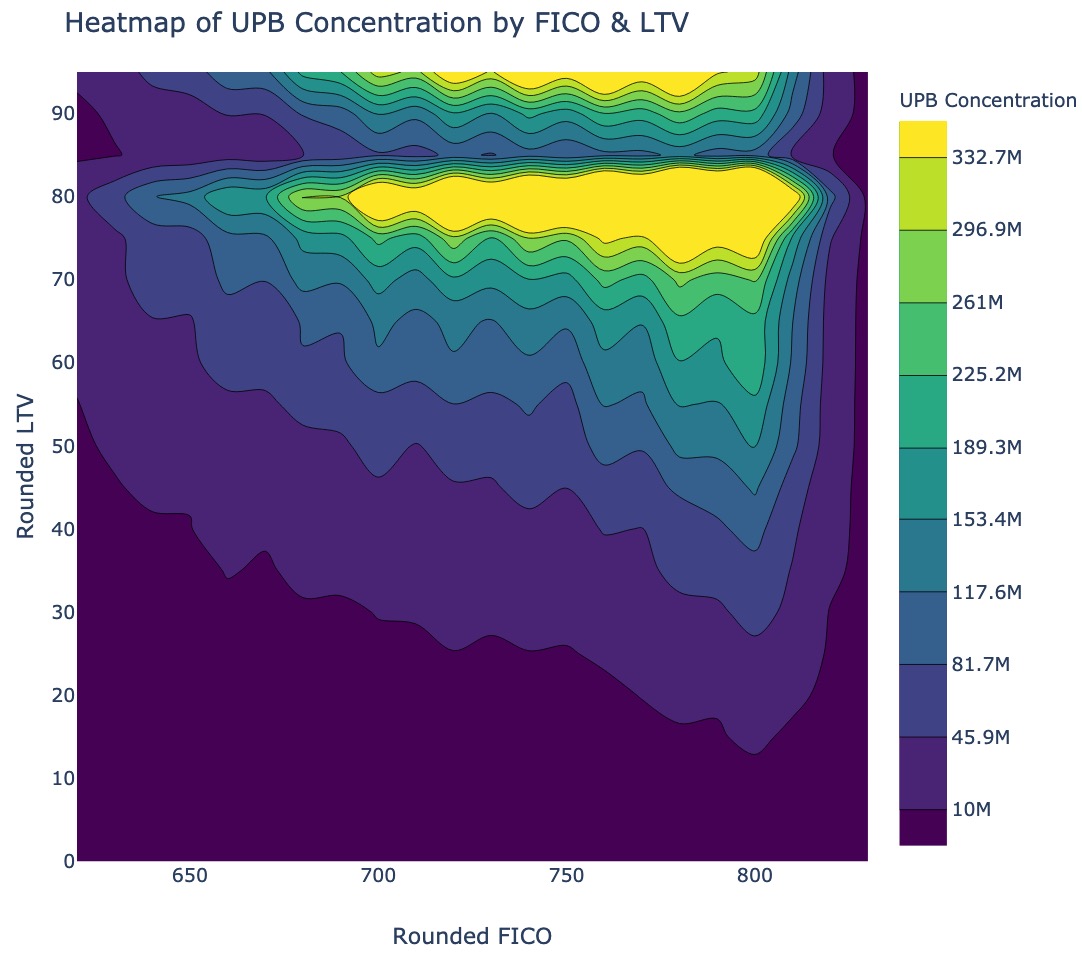
  1. Quick and simple data visualizations with Plotly Express.
  2. Additional control and complexity with base Plotly.

Example Visualization from this Section:

Homework Exercises

There is a homework associated with these materials, for those interested. Given the open-ended nature of the homework, there is no answer key. That said, if you're working through it and would like some feedback, feel free to reach out to me via LinkedIn.

Here is the link to the easy-to-view homework notebook.
Here is the link to the GitHub-hosted version of the homework notebook.

Setup Instructions

  • clone this repository
  • create a virtual environment using python3 -m venv env
  • activate that virtual environment using source env/bin/activate
  • install needed packages using pip install -r requirements.txt
  • run an instance of jupyter lab out of your virutal env using env/bin/jupyter-lab
  • open and run the four main files of content for this course--one for each section:
    • part_1_main_nb.ipynb
    • part_2_main_nb.ipynb
    • part_3_main_nb.ipynb
    • part_4_main_nb.ipynb
Owner
Paul Jeffries
Trained in intl. econ; started in mortgage finance; dabbled in equities & crypto; now working in banking. I enjoy challenging questions regarding value & risk.
Paul Jeffries
trade bot connected to binance API/ websocket.,, include dashboard in plotly dash to visualize trades and balances

Crypto trade bot 1. What it is Trading bot connected to Binance API. This project made for fun. So ... Do not use to trade live before you have backte

G 3 Oct 07, 2022
a robust room presence solution for home automation with nearly no false negatives

Argos Room Presence This project builds a room presence solution on top of Argos. Using just a cheap raspberry pi zero w (plus an attached pi camera,

Angad Singh 46 Sep 18, 2022
Flipper Zero documentation repo

Flipper Zero Docs Participation To fix a bug or add something new to this repository, you need to open a pull-request. Also, on every page of the site

Flipper Zero (All Repositories will be public soon) 114 Dec 30, 2022
Uniform Manifold Approximation and Projection

UMAP Uniform Manifold Approximation and Projection (UMAP) is a dimension reduction technique that can be used for visualisation similarly to t-SNE, bu

Leland McInnes 6k Jan 08, 2023
BGraph is a tool designed to generate dependencies graphs from Android.bp soong files.

BGraph BGraph is a tool designed to generate dependencies graphs from Android.bp soong files. Overview BGraph (for Build-Graphs) is a project aimed at

Quarkslab 10 Dec 19, 2022
Quickly and accurately render even the largest data.

Turn even the largest data into images, accurately Build Status Coverage Latest dev release Latest release Docs Support What is it? Datashader is a da

HoloViz 2.9k Dec 28, 2022
A napari plugin for visualising and interacting with electron cryotomograms.

napari-tomoslice A napari plugin for visualising and interacting with electron cryotomograms. Installation You can install napari-tomoslice via pip: p

3 Jan 03, 2023
A little word cloud generator in Python

Linux macOS Windows PyPI word_cloud A little word cloud generator in Python. Read more about it on the blog post or the website. The code is tested ag

Andreas Mueller 9.2k Dec 30, 2022
A Python Binder that merge 2 files with any extension by creating a new python file and compiling it to exe which runs both payloads.

Update ! ANONFILE MIGHT NOT WORK ! About A Python Binder that merge 2 files with any extension by creating a new python file and compiling it to exe w

Vesper 15 Oct 12, 2022
Python script for writing text on github contribution chart.

Github Contribution Drawer Python script for writing text on github contribution chart. Requirements Python 3.X Getting Started Create repository Put

Steven 0 May 27, 2022
Flexitext is a Python library that makes it easier to draw text with multiple styles in Matplotlib

Flexitext is a Python library that makes it easier to draw text with multiple styles in Matplotlib

Tomás Capretto 93 Dec 28, 2022
An(other) implementation of JSON Schema for Python

jsonschema jsonschema is an implementation of JSON Schema for Python. from jsonschema import validate # A sample schema, like what we'd get f

Julian Berman 4k Jan 04, 2023
Extract data from ThousandEyes REST API and visualize it on your customized Grafana Dashboard.

ThousandEyes Grafana Dashboard Extract data from the ThousandEyes REST API and visualize it on your customized Grafana Dashboard. Deploy Grafana, Infl

Flo Pachinger 16 Nov 26, 2022
Create artistic visualisations with your exercise data (Python version)

strava_py Create artistic visualisations with your exercise data (Python version). This is a port of the R strava package to Python. Examples Facets A

Marcus Volz 53 Dec 28, 2022
Leyna's Visualizing Data With Python

Leyna's Visualizing Data Below is information on the number of bilingual students in three school districts in Massachusetts. You will also find infor

11 Oct 28, 2021
Implementation of SOMs (Self-Organizing Maps) with neighborhood-based map topologies.

py-self-organizing-maps Simple implementation of self-organizing maps (SOMs) A SOM is an unsupervised method for learning a mapping from a discrete ne

Jonas Grebe 6 Nov 22, 2022
Wikipedia WordCloud App generate Wikipedia word cloud art created using python's streamlit, matplotlib, wikipedia and wordcloud packages

Wikipedia WordCloud App Wikipedia WordCloud App generate Wikipedia word cloud art created using python's streamlit, matplotlib, wikipedia and wordclou

Siva Prakash 5 Jan 02, 2022
Lime: Explaining the predictions of any machine learning classifier

lime This project is about explaining what machine learning classifiers (or models) are doing. At the moment, we support explaining individual predict

Marco Tulio Correia Ribeiro 10.3k Dec 29, 2022
Data visualization using matplotlib

Data visualization using matplotlib project instructions Top 5 Most Common Coffee Origins In this visualization I used data from Ankur Chavda on Kaggl

13 Oct 27, 2021
nvitop, an interactive NVIDIA-GPU process viewer, the one-stop solution for GPU process management

An interactive NVIDIA-GPU process viewer, the one-stop solution for GPU process management.

Xuehai Pan 1.3k Jan 02, 2023