Render Jupyter notebook in the terminal

Overview

jut - JUpyter notebook Terminal viewer.

The command line tool view the IPython/Jupyter notebook in the terminal.

Install

pip install jut

Usage

$jut --help
Usage: jut [OPTIONS]

Options:
  -u, --url TEXT             Render the ipynb file from the URL
  -i, --input-file FILENAME  File from the local file-system
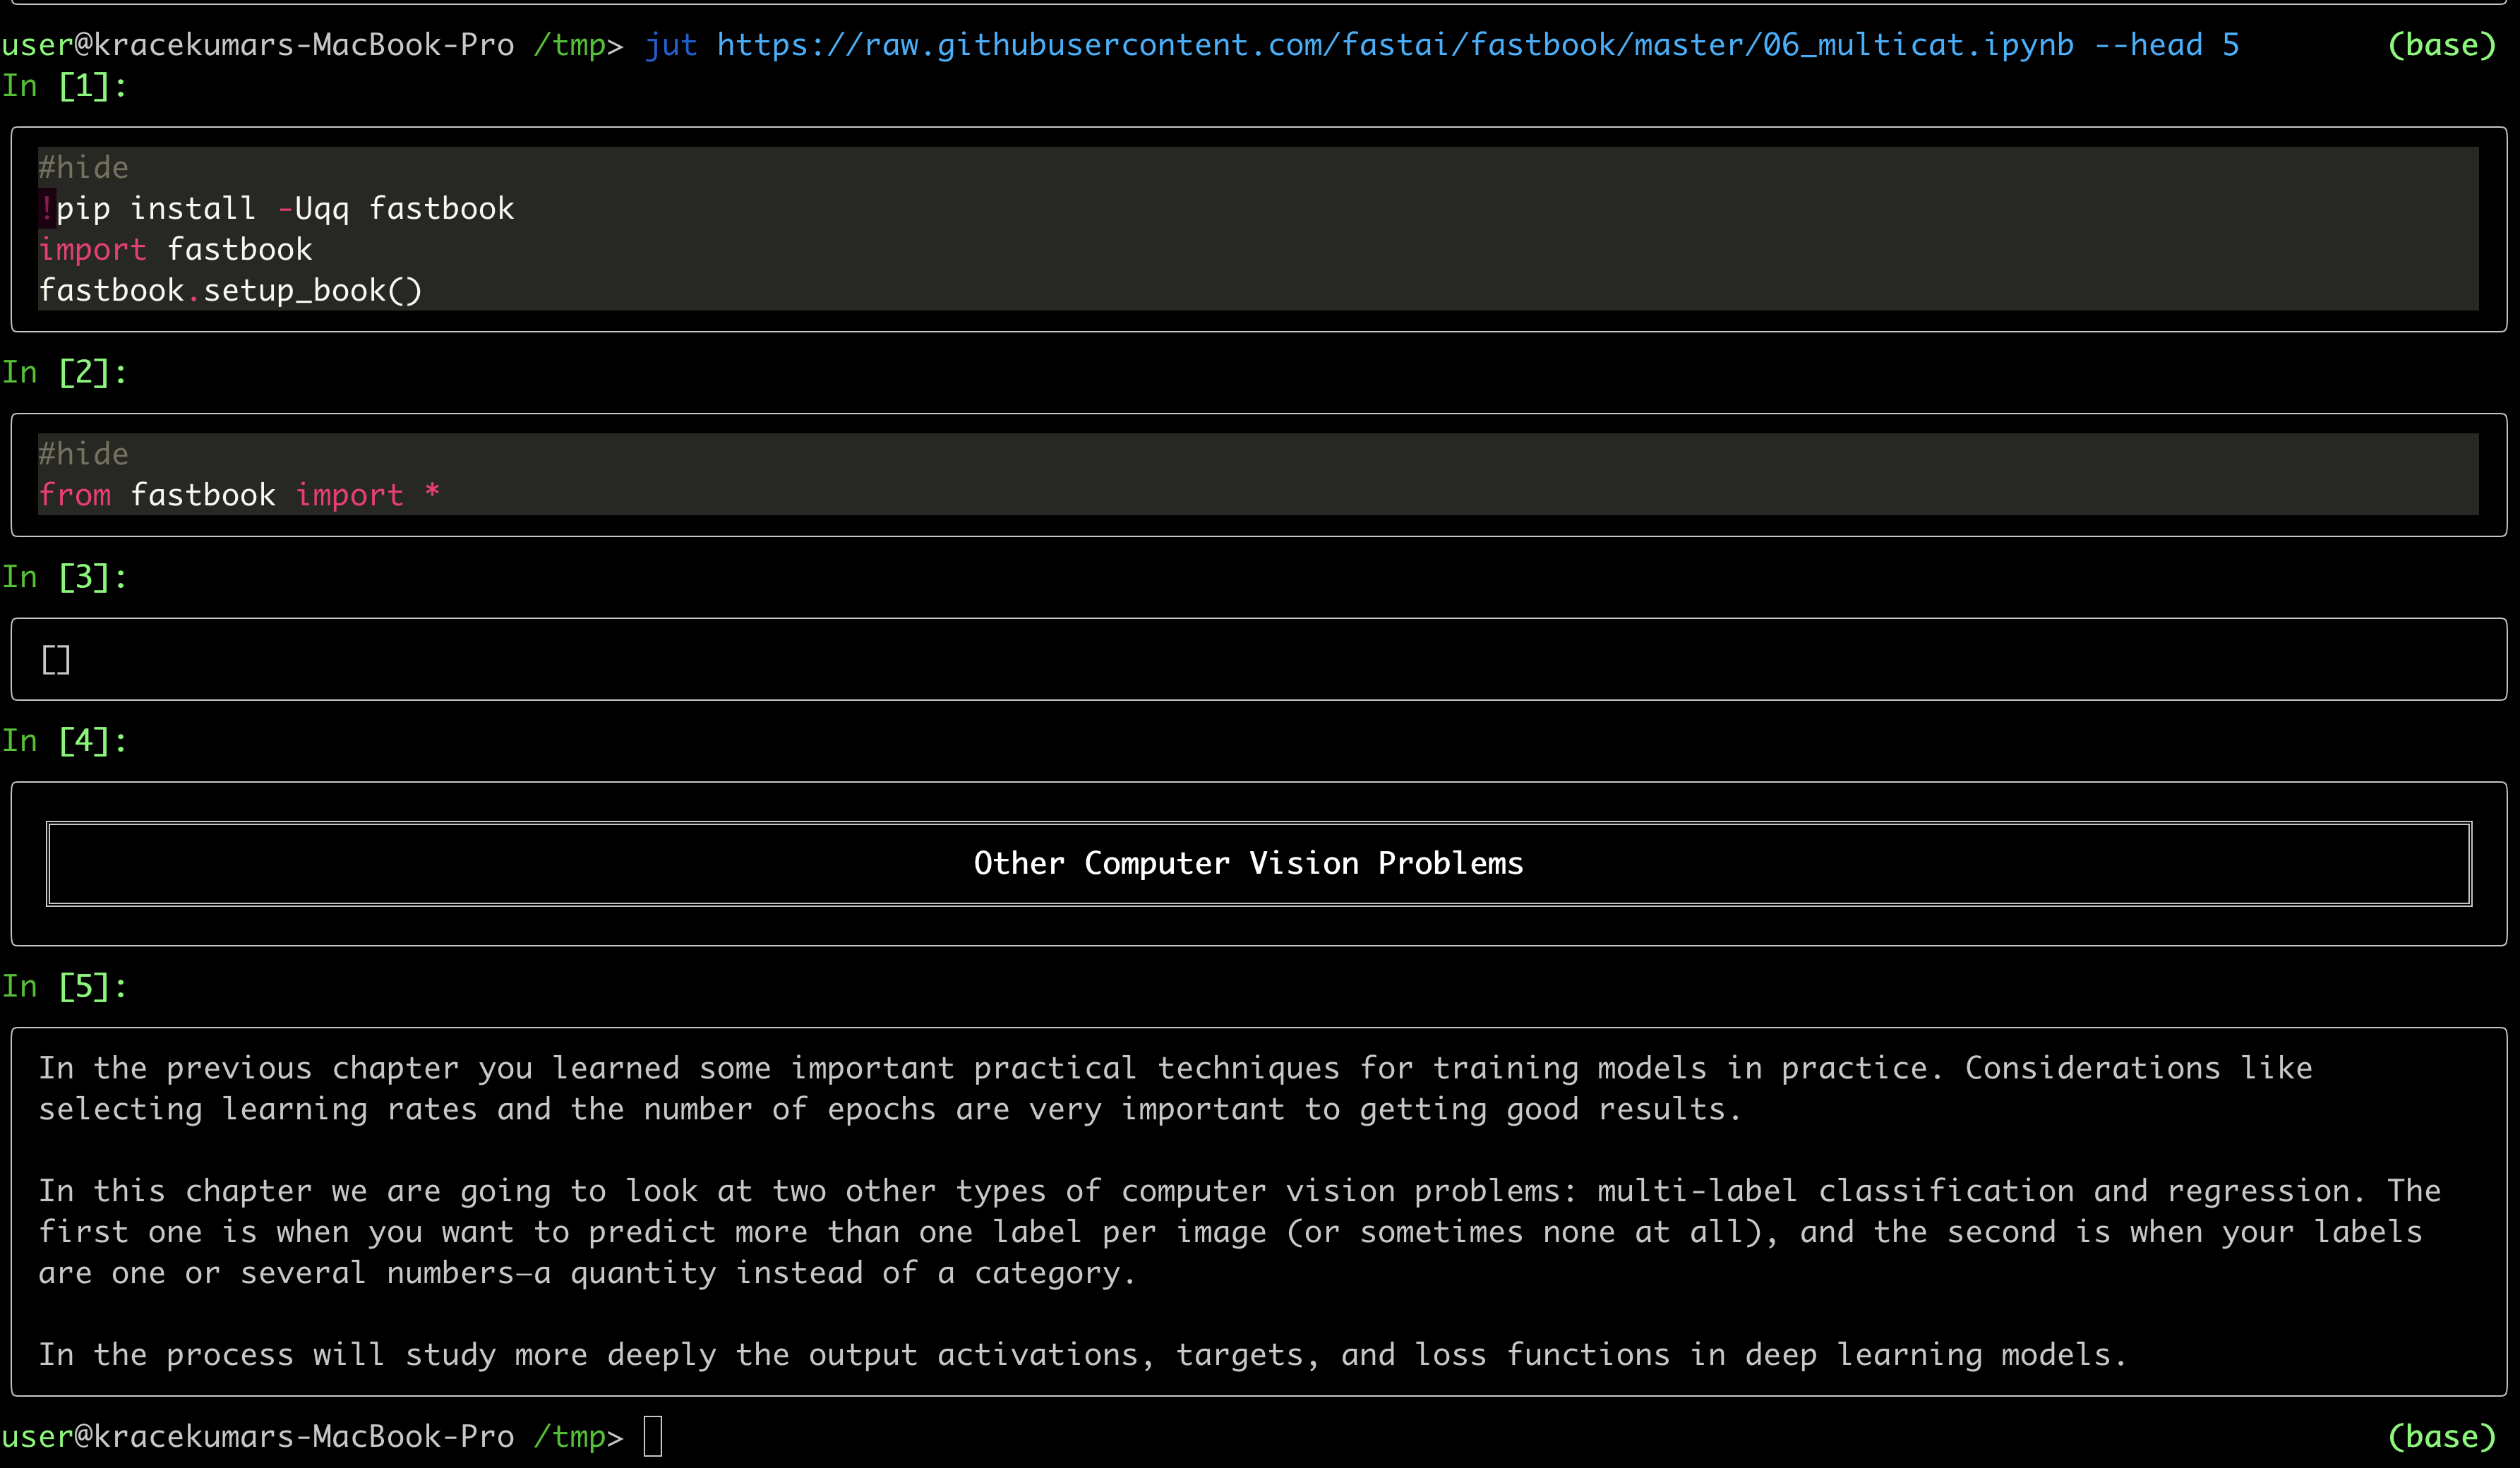
  -h, --head INTEGER         Display first n cells. Default is 10
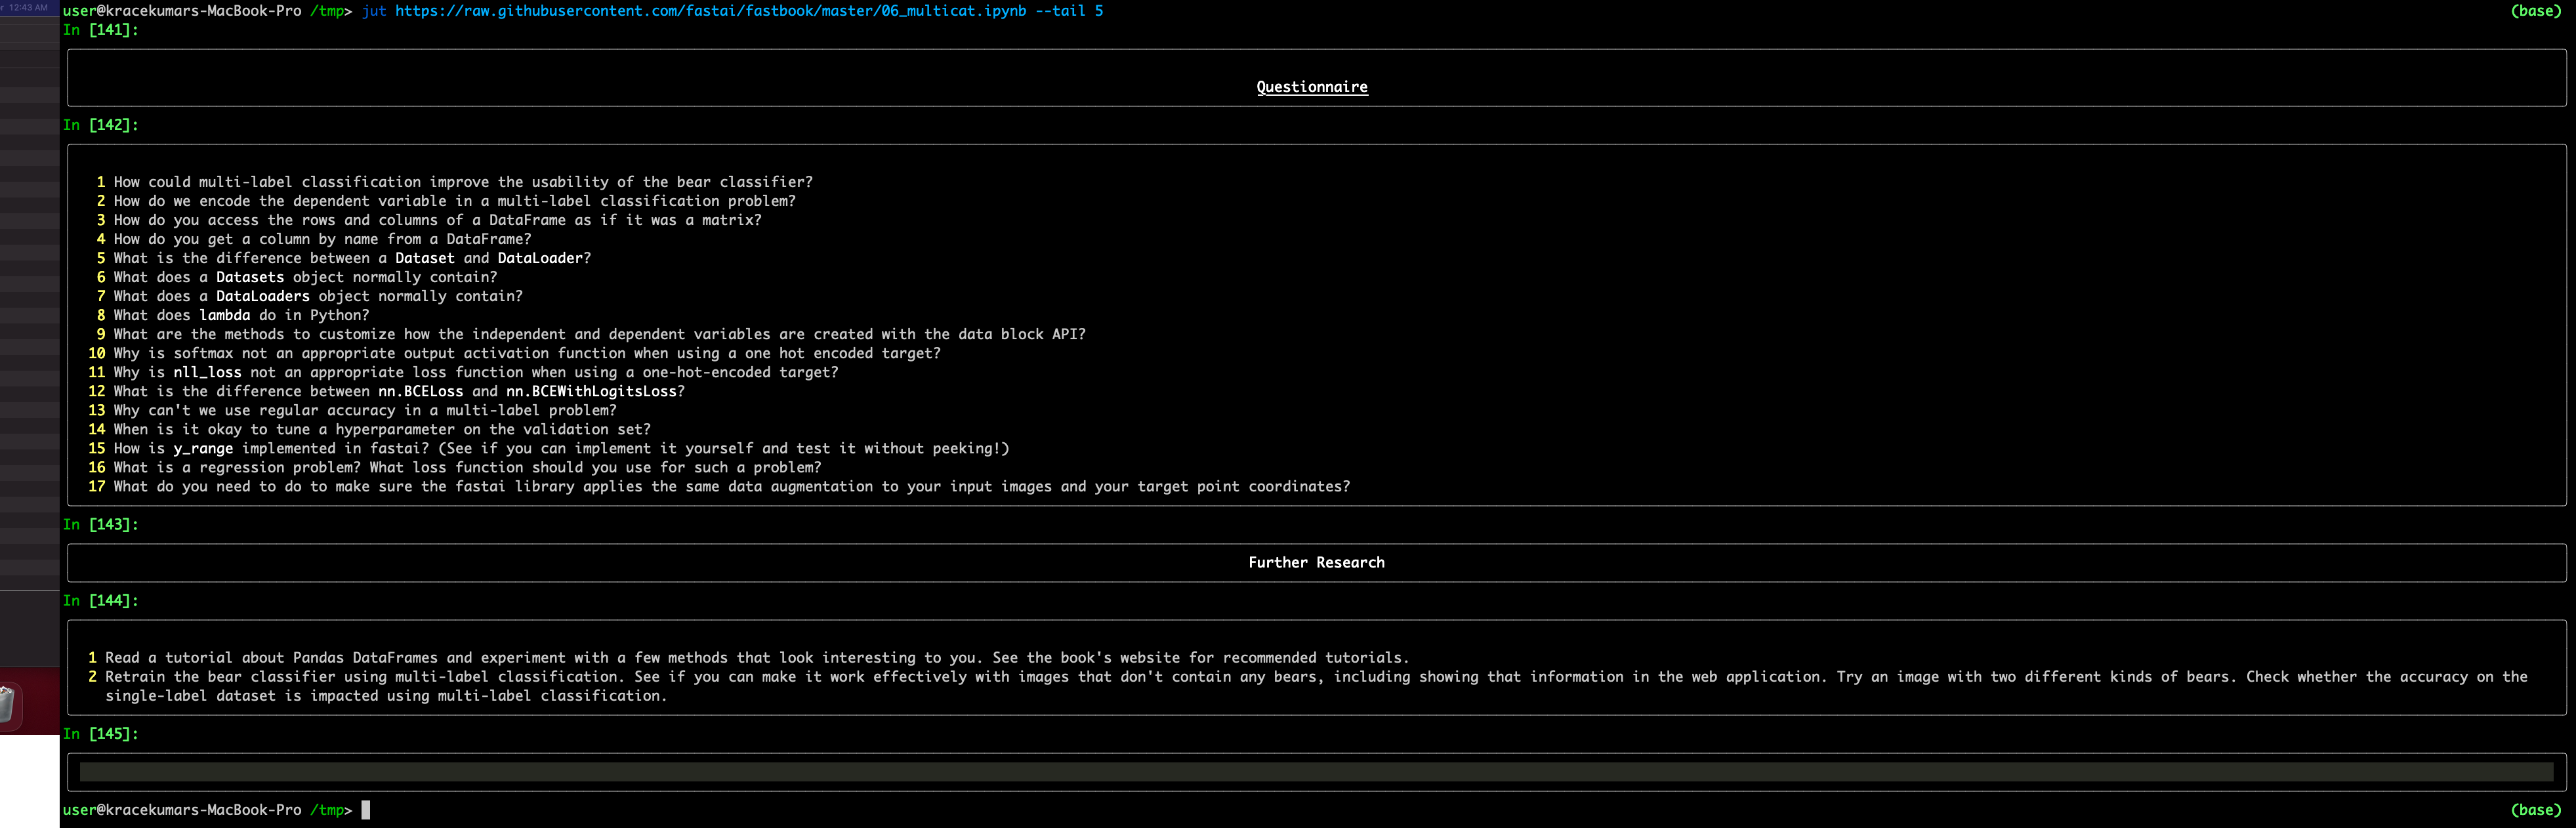
  -t, --tail INTEGER         Display last n cells
  -p, --single-page          Should the result be in a single page?
  -f, --full-display         Should all the contents in the file displayed?
  --help                     Show this message and exit.

ASCIICinema Demo

asciicast

Display first five cells

jut-head-example

Display last five cells

jut-tail-example

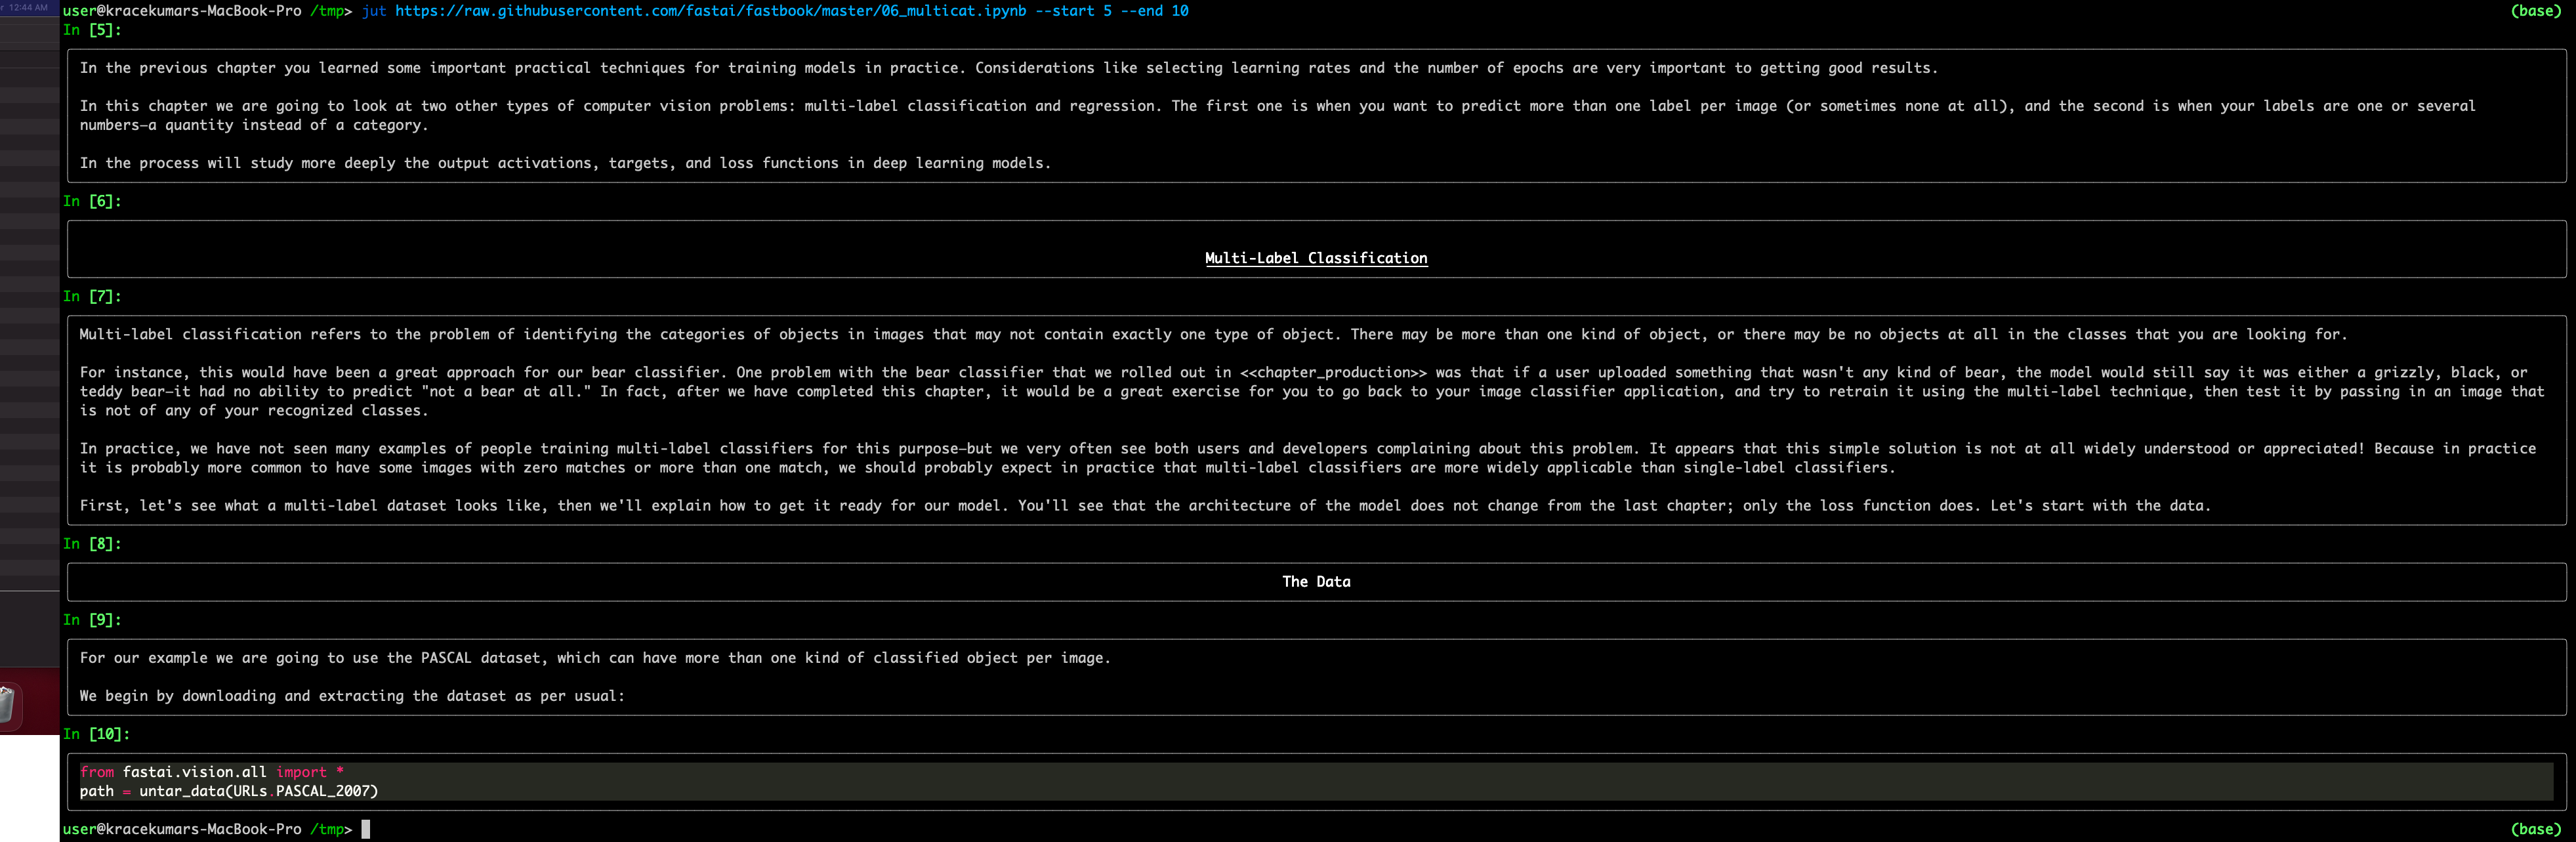
Download the file and display first five cells

jut-download-url

Owner
Kracekumar
Server side guy specializing in Python. I am interested in back-end technologies, machine learning, automation, systems and performance.
Kracekumar
Lightspin AWS IAM Vulnerability Scanner

Red-Shadow Lightspin AWS IAM Vulnerability Scanner Description Scan your AWS IAM Configuration for shadow admins in AWS IAM based on misconfigured den

Lightspin 90 Dec 14, 2022
Visualization Website by using Dash and Heroku

Visualization Website by using Dash and Heroku You can visit the website https://payroll-expense-analysis.herokuapp.com/ In this project, I am interes

YF Liu 1 Jan 14, 2022
RockNext is an Open Source extending ERPNext built on top of Frappe bringing enterprise ready utilization.

RockNext is an Open Source extending ERPNext built on top of Frappe bringing enterprise ready utilization.

Matheus Breguêz 13 Oct 12, 2022
Python module for drawing and rendering beautiful atoms and molecules using Blender.

Batoms is a Python package for editing and rendering atoms and molecules objects using blender. A Python interface that allows for automating workflows.

Xing Wang 1 Jul 06, 2022
The implementation of the paper "HIST: A Graph-based Framework for Stock Trend Forecasting via Mining Concept-Oriented Shared Information".

The HIST framework for stock trend forecasting The implementation of the paper "HIST: A Graph-based Framework for Stock Trend Forecasting via Mining C

Wentao Xu 111 Jan 03, 2023
Cryptocurrency Centralized Exchange Visualization

This is a simple one that uses Grafina to visualize cryptocurrency from the Bitkub exchange. This service will make a request to the Bitkub API from your wallet and save the response to Postgresql. G

Popboon Mahachanawong 1 Nov 24, 2021
A way of looking at COVID-19 data that I haven't seen before.

Visualizing Omicron: COVID-19 Deaths vs. Cases Click here for other countries. Data is from Our World in Data/Johns Hopkins University. About this pro

1 Jan 10, 2022
Bcc2telegraf: An integration that sends ebpf-based bcc histogram metrics to telegraf daemon

bcc2telegraf bcc2telegraf is an integration that sends ebpf-based bcc histogram

Peter Bobrov 2 Feb 17, 2022
Generate visualizations of GitHub user and repository statistics using GitHub Actions.

GitHub Stats Visualization Generate visualizations of GitHub user and repository statistics using GitHub Actions. This project is currently a work-in-

JoelImgu 3 Dec 14, 2022
China and India Population and GDP Visualization

China and India Population and GDP Visualization Historical Population Comparison between India and China This graph shows the population data of Indi

Nicolas De Mello 10 Oct 27, 2021
Attractors is a package for simulation and visualization of strange attractors.

attractors Attractors is a package for simulation and visualization of strange attractors. Installation The simplest way to install the module is via

Vignesh M 45 Jul 31, 2022
Lightweight, extensible data validation library for Python

Cerberus Cerberus is a lightweight and extensible data validation library for Python. v = Validator({'name': {'type': 'string'}}) v.validate({

eve 2.9k Dec 27, 2022
Realtime Web Apps and Dashboards for Python and R

H2O Wave Realtime Web Apps and Dashboards for Python and R New! R Language API Build and control Wave dashboards using R! New! Easily integrate AI/ML

H2O.ai 3.4k Jan 06, 2023
Collection of scripts for making high quality beautiful math-related posters.

Poster Collection of scripts for making high quality beautiful math-related posters. The poster can have as large printing size as 3x2 square feet wit

Nattawut Phetmak 3 Jun 09, 2022
Ana's Portfolio

Ana's Portfolio ✌️ Welcome to my Portfolio! You will find here different Projects I have worked on (from scratch) 💪 Projects 💻 1️⃣ Hangman game (Mad

Ana Katherine Cortes Sobrino 9 Mar 15, 2022
A toolkit to generate MR sequence diagrams

mrsd: a toolkit to generate MR sequence diagrams mrsd is a Python toolkit to generate MR sequence diagrams, as shown below for the basic FLASH sequenc

Julien Lamy 3 Dec 25, 2021
A package for plotting maps in R with ggplot2

Attention! Google has recently changed its API requirements, and ggmap users are now required to register with Google. From a user’s perspective, ther

David Kahle 719 Jan 04, 2023
Parallel t-SNE implementation with Python and Torch wrappers.

Multicore t-SNE This is a multicore modification of Barnes-Hut t-SNE by L. Van der Maaten with python and Torch CFFI-based wrappers. This code also wo

Dmitry Ulyanov 1.7k Jan 09, 2023
Color maps for POV-Ray v3.7 from the Plasma, Inferno, Magma and Viridis color maps in Python's Matplotlib

POV-Ray-color-maps Color maps for POV-Ray v3.7 from the Plasma, Inferno, Magma and Viridis color maps in Python's Matplotlib. The include file Color_M

Tor Olav Kristensen 1 Apr 05, 2022
Simple implementation of Self Organizing Maps (SOMs) with rectangular and hexagonal grid topologies

py-self-organizing-map Simple implementation of Self Organizing Maps (SOMs) with rectangular and hexagonal grid topologies. A SOM is a simple unsuperv

Jonas Grebe 1 Feb 10, 2022