A Python wrapper of Neighbor Retrieval Visualizer (NeRV)

Overview

PyNeRV

A Python wrapper of the dimensionality reduction algorithm Neighbor Retrieval Visualizer (NeRV)

Compile

Set up the paths in Makefile then make.

Usage example

import numpy as np
import matplotlib.pyplot as plt
from nerv import NeRV

data = np.genfromtxt('dredviz-1.0.2/spheredata.dat', skip_header=1)
color = np.genfromtxt('dredviz-1.0.2/spheredata.col', skip_header=1)
nerv_obj = NeRV(random_state=0)
nerv_obj.fit(data)
print('Final cost = %g' % nerv_obj.cost_)
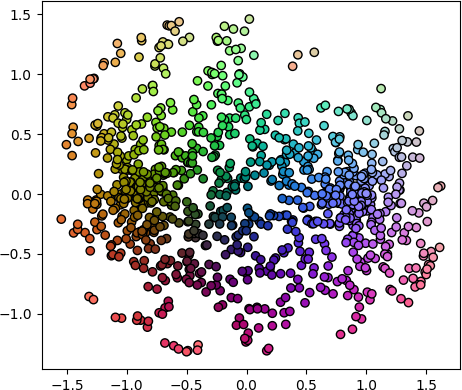
plt.scatter(*nerv_obj.embedding_.T, c=color)
plt.show()

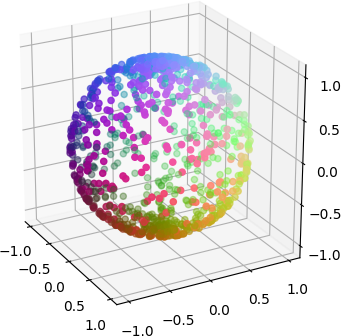
which shows (right)


Reference

@article{venna2010information,
  title={Information retrieval perspective to nonlinear dimensionality reduction for data visualization},
  author={Venna, Jarkko and Peltonen, Jaakko and Nybo, Kristian and Aidos, Helena and Kaski, Samuel},
  journal={Journal of Machine Learning Research},
  volume={11},
  number={Feb},
  pages={451--490},
  year={2010}
}
cqMore is a CadQuery plugin based on CadQuery 2.1.

cqMore (under construction) cqMore is a CadQuery plugin based on CadQuery 2.1. Installation Please use conda to install CadQuery and its dependencies

Justin Lin 36 Dec 21, 2022
Homework 2: Matplotlib and Data Visualization

Homework 2: Matplotlib and Data Visualization Overview These data visualizations were created for my introductory computer science course using Python

Sophia Huang 12 Oct 20, 2022
Ana's Portfolio

Ana's Portfolio ✌️ Welcome to my Portfolio! You will find here different Projects I have worked on (from scratch) 💪 Projects 💻 1️⃣ Hangman game (Mad

Ana Katherine Cortes Sobrino 9 Mar 15, 2022
Create HTML profiling reports from pandas DataFrame objects

Pandas Profiling Documentation | Slack | Stack Overflow Generates profile reports from a pandas DataFrame. The pandas df.describe() function is great

10k Jan 01, 2023
Flipper Zero documentation repo

Flipper Zero Docs Participation To fix a bug or add something new to this repository, you need to open a pull-request. Also, on every page of the site

Flipper Zero (All Repositories will be public soon) 114 Dec 30, 2022
Visualizations for machine learning datasets

Introduction The facets project contains two visualizations for understanding and analyzing machine learning datasets: Facets Overview and Facets Dive

PAIR code 7.1k Jan 07, 2023
A Jupyter - Three.js bridge

pythreejs A Python / ThreeJS bridge utilizing the Jupyter widget infrastructure. Getting Started Installation Using pip: pip install pythreejs And the

Jupyter Widgets 844 Dec 27, 2022
Data Visualizer Web-Application

Viz-It Data Visualizer Web-Application If I ask you where most of the data wrangler looses their time ? It is Data Overview and EDA. Presenting "Viz-I

Sagnik Roy 17 Nov 20, 2022
A little word cloud generator in Python

Linux macOS Windows PyPI word_cloud A little word cloud generator in Python. Read more about it on the blog post or the website. The code is tested ag

Andreas Mueller 9.2k Dec 30, 2022
📊📈 Serves up Pandas dataframes via the Django REST Framework for use in client-side (i.e. d3.js) visualizations and offline analysis (e.g. Excel)

📊📈 Serves up Pandas dataframes via the Django REST Framework for use in client-side (i.e. d3.js) visualizations and offline analysis (e.g. Excel)

wq framework 1.2k Jan 01, 2023
Seismic Waveform Inversion Toolbox-1.0

Seismic Waveform Inversion Toolbox (SWIT-1.0)

Haipeng Li 98 Dec 29, 2022
Visualize large time-series data in plotly

plotly_resampler enables visualizing large sequential data by adding resampling functionality to Plotly figures. In this Plotly-Resampler demo over 11

PreDiCT.IDLab 604 Dec 28, 2022
Python Package for CanvasXpress JS Visualization Tools

CanvasXpress Python Library About CanvasXpress for Python CanvasXpress was developed as the core visualization component for bioinformatics and system

Dr. Todd C. Brett 5 Nov 07, 2022
Generate visualizations of GitHub user and repository statistics using GitHub Actions.

GitHub Stats Visualization Generate visualizations of GitHub user and repository statistics using GitHub Actions. This project is currently a work-in-

JoelImgu 3 Dec 14, 2022
Bokeh Plotting Backend for Pandas and GeoPandas

Pandas-Bokeh provides a Bokeh plotting backend for Pandas, GeoPandas and Pyspark DataFrames, similar to the already existing Visualization feature of

Patrik Hlobil 822 Jan 07, 2023
Pydrawer: The Python package for visualizing curves and linear transformations in a super simple way

pydrawer 📐 The Python package for visualizing curves and linear transformations in a super simple way. ✏️ Installation Install pydrawer package with

Dylan Tintenfich 56 Dec 30, 2022
daily report of @arkinvest ETF activity + data collection

ark_invest daily weekday report of @arkinvest ETF activity + data collection This script was created to: Extract and save daily csv's from ARKInvest's

T D 27 Jan 02, 2023
A comprehensive tutorial for plotting focal mechanism

Focal_Mechanisms_Demo A comprehensive tutorial for plotting focal mechanism "beach-balls" using the PyGMT package for Python. (Resulting map of this d

3 Dec 13, 2022
The interactive graphing library for Python (includes Plotly Express) :sparkles:

plotly.py Latest Release User forum PyPI Downloads License Data Science Workspaces Our recommended IDE for Plotly’s Python graphing library is Dash En

Plotly 12.7k Jan 05, 2023