PyPassword is a simple follow up to PyPassphrase

Overview

PyPassword

PyPassword is a simple follow up to PyPassphrase. After finishing that project it occured to me that while some may wish to use that option, may not be able to do so due to pre-defined password requirements (for example, spaces not allowed or an arbitrary limit on the number of characters). Therefore, it seemed reasonable to create a more traditional password generator but wrap it also in a GUI frontend with PySimpleGUI.

There is nothing particularly special about this application past its compliment to PyPassphrase. In fact, I will likely merge the two applications so that both options exist in one.

Stay Tuned!

In the meantime, if you choose to use this as a stand-alone password generator keep in mind no attempts are made to make the resulting passwords easier to remember and it is highly recommended that you use a trusted and secure password manager such as Keepass or Linux Pass to store and manage the passwords.

The passwords are generated using the Python string library using lowercase, uppercase, digits and punctuation characters. Which group is used is chosen at random using the Python secrets library. A loop is used to randomize the list of characters and then from that list a random sample is taken that is the length of the password specified.

The result is some truly cyrptic passwords that, if using sufficient length (generally 15 characters or more), will be strong enough for most applications.

Currently only the command line option exists to launch the application and that for only Linux at the moment. To use the application simply download the binary and from the location where it is saved launch a terminal session and run the command ./pypassword. This will launch the GUI frontend.

Screenshots

You might also like...
A simple script that displays pixel-based animation on GitHub Activity

GitHub Activity Animator This project contains a simple Javascript snippet that produces an animation on your GitHub activity tracker. The project als

A simple python tool for explore your object detection dataset

A simple tool for explore your object detection dataset. The goal of this library is to provide simple and intuitive visualizations from your dataset and automatically find the best parameters for generating a specific grid of anchors that can fit you data characteristics

A deceptively simple plotting library for Streamlit

🍅 Plost A deceptively simple plotting library for Streamlit. Because you've been writing plots wrong all this time. Getting started pip install plost

Simple spectra visualization tool for astronomers

SpecViewer A simple visualization tool for astronomers. Dependencies Python = 3.7.4 PyQt5 = 5.15.4 pyqtgraph == 0.10.0 numpy = 1.19.4 How to use py

Simple CLI python app to show a stocks graph performance. Made with Matplotlib and Tiingo.

stock-graph-python Simple CLI python app to show a stocks graph performance. Made with Matplotlib and Tiingo. Tiingo API Key You will need to add your

Simple Inkscape Scripting

Simple Inkscape Scripting Description In the Inkscape vector-drawing program, how would you go about drawing 100 diamonds, each with a random color an

eoplatform is a Python package that aims to simplify Remote Sensing Earth Observation by providing actionable information on a wide swath of RS platforms and provide a simple API for downloading and visualizing RS imagery

An Earth Observation Platform Earth Observation made easy. Report Bug | Request Feature About eoplatform is a Python package that aims to simplify Rem

simple tool to paint axis x and y

simple tool to paint axis x and y

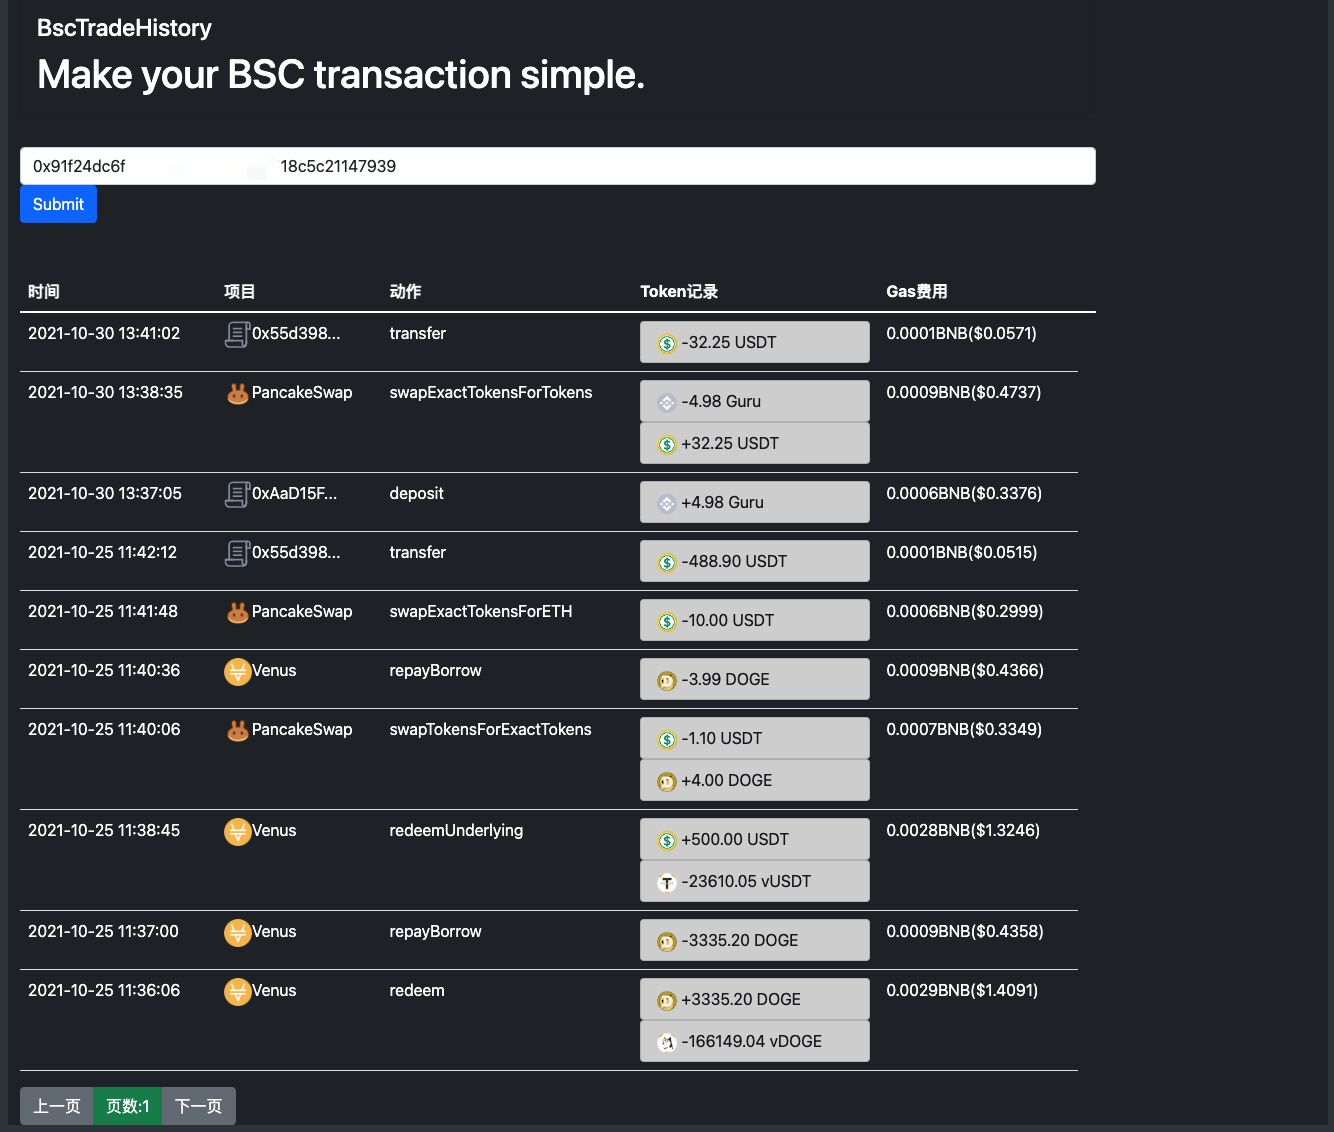
Make your BSC transaction simple.

bsc_trade_history Make your BSC transaction simple. 中文ReadMe Background: inspired by debank ,Practice my hands on this small project Blog:Crypto-BscTr

Comments
Releases(v1.1.0)
Owner
Scotty
Scotty
HW_02 Data visualisation task

HW_02 Data visualisation and Matplotlib practice Instructions for HW_02 Idea for data analysis As I was brainstorming ideas and running through databa

9 Dec 13, 2022
Simple Python interface for Graphviz

Simple Python interface for Graphviz

Sebastian Bank 1.3k Dec 26, 2022
Gaphas is the diagramming widget library for Python.

Gaphas Gaphas is the diagramming widget library for Python. Gaphas is a library that provides the user interface component (widget) for drawing diagra

Gaphor 144 Dec 14, 2022
An automatic prover for tautologies in Metamath

completeness An automatic prover for tautologies in Metamath This program implements the constructive proof of the Completeness Theorem for propositio

Scott Fenton 2 Dec 15, 2021
Python scripts to manage Chia plots and drive space, providing full reports. Also monitors the number of chia coins you have.

Chia Plot, Drive Manager & Coin Monitor (V0.5 - April 20th, 2021) Multi Server Chia Plot and Drive Management Solution Be sure to ⭐ my repo so you can

338 Nov 25, 2022
Pyan3 - Offline call graph generator for Python 3

Pyan takes one or more Python source files, performs a (rather superficial) static analysis, and constructs a directed graph of the objects in the combined source, and how they define or use each oth

Juha Jeronen 235 Jan 02, 2023
A set of three functions, useful in geographical calculations of different sorts

GreatCircle A set of three functions, useful in geographical calculations of different sorts. Available for PHP, Python, Javascript and Ruby. Live dem

72 Sep 30, 2022
Tools for exploratory data analysis in Python

Dora Exploratory data analysis toolkit for Python. Contents Summary Setup Usage Reading Data & Configuration Cleaning Feature Selection & Extraction V

Nathan Epstein 599 Dec 25, 2022
Visualize large time-series data in plotly

plotly_resampler enables visualizing large sequential data by adding resampling functionality to Plotly figures. In this Plotly-Resampler demo over 11

PreDiCT.IDLab 604 Dec 28, 2022
Data Visualizer Web-Application

Viz-It Data Visualizer Web-Application If I ask you where most of the data wrangler looses their time ? It is Data Overview and EDA. Presenting "Viz-I

Sagnik Roy 17 Nov 20, 2022
This project is an Algorithm Visualizer where a user can visualize algorithms like Bubble Sort, Merge Sort, Quick Sort, Selection Sort, Linear Search and Binary Search.

Algo_Visualizer This project is an Algorithm Visualizer where a user can visualize common algorithms like "Bubble Sort", "Merge Sort", "Quick Sort", "

Rahul 4 Feb 07, 2022
Flame Graphs visualize profiled code

Flame Graphs visualize profiled code

Brendan Gregg 14.1k Jan 03, 2023
This GitHub Repository contains Data Analysis projects that I have completed so far! While most of th project are focused on Data Analysis, some of them are also put here to show off other skills that I have learned.

Welcome to my Data Analysis projects page! This GitHub Repository contains Data Analysis projects that I have completed so far! While most of th proje

Kyle Dini 1 Jan 31, 2022
A package for plotting maps in R with ggplot2

Attention! Google has recently changed its API requirements, and ggmap users are now required to register with Google. From a user’s perspective, ther

David Kahle 719 Jan 04, 2023
Design your own matplotlib stylefile interactively

Tired of playing with font sizes and other matplotlib parameters every time you start a new project or write a new plotting function? Want all you plots have the same style? Use matplotlib configurat

yobi byte 207 Dec 08, 2022
Getting started with Python, Dash and Plot.ly for the Data Dashboards team

data_dashboards Getting started with Python, Dash and Plot.ly for the Data Dashboards team Getting started MacOS users: # Install the pyenv version ma

Department for Levelling Up, Housing and Communities 1 Nov 08, 2021
Draw datasets from within Jupyter.

drawdata This small python app allows you to draw a dataset in a jupyter notebook. This should be very useful when teaching machine learning algorithm

vincent d warmerdam 505 Nov 27, 2022
demir.ai Dataset Operations

demir.ai Dataset Operations With this application, you can have the empty values (nan/null) deleted or filled before giving your dataset to machine le

Ahmet Furkan DEMIR 8 Nov 01, 2022
Python support for Godot 🐍🐍🐍

Godot Python, because you want Python on Godot ! The goal of this project is to provide Python language support as a scripting module for the Godot ga

Emmanuel Leblond 1.4k Jan 04, 2023
Fastest Gephi's ForceAtlas2 graph layout algorithm implemented for Python and NetworkX

ForceAtlas2 for Python A port of Gephi's Force Atlas 2 layout algorithm to Python 2 and Python 3 (with a wrapper for NetworkX and igraph). This is the

Bhargav Chippada 227 Jan 05, 2023