2D maze path solver visualizer implemented with python

Overview

Maze PathFinder Visualizer implemented in Python

How to use

Download:

git clone https://github.com/ss892714028/Maze-PathFinder-Visualization-Python

Install required Libraries

pip install -r requirements.txt

Settings

Go to config.py and change settings.

  • 'w': width of the board
  • 'h': height of the board
  • 'algo':'bfs' for Breadth first search
  • 'algo':'dfs' for Depth first search
  • 'algo':'astar' for A*

Run the visualization

python ./src/drawer.py
  • The first two left clicks on the board initialize start and end node
  • Click or click and drag to create obstacles
  • Press space bar and see the algorithm takes off!

Symbols

  • "@": Start and end node
  • "#": Obstacles
  • "*": Visited node
  • "+": Path

Contributions

All contributions are welcome. :)

Algorithm Implemented

  • BFS (unweighted Dijastra)
  • DFS
  • ASTAR (A*)

Breadth First Search (unweighted Dijkstra)

Breadth First Search is unweighted and guarantee a optimal path. BFS

Depth First Search

Depth First Search is unweighted and does not guarantee a optimal path. DFS

Astar (A*)

A* is weighted and guarantee a optimal path.
A* easy A*

You might also like...
A python visualization of the A* path finding algorithm

A python visualization of the A* path finding algorithm. It allows you to pick your start, end location and make obstacles and then view the process of finding the shortest path. You can also choose to include or exclude diagonal movement.

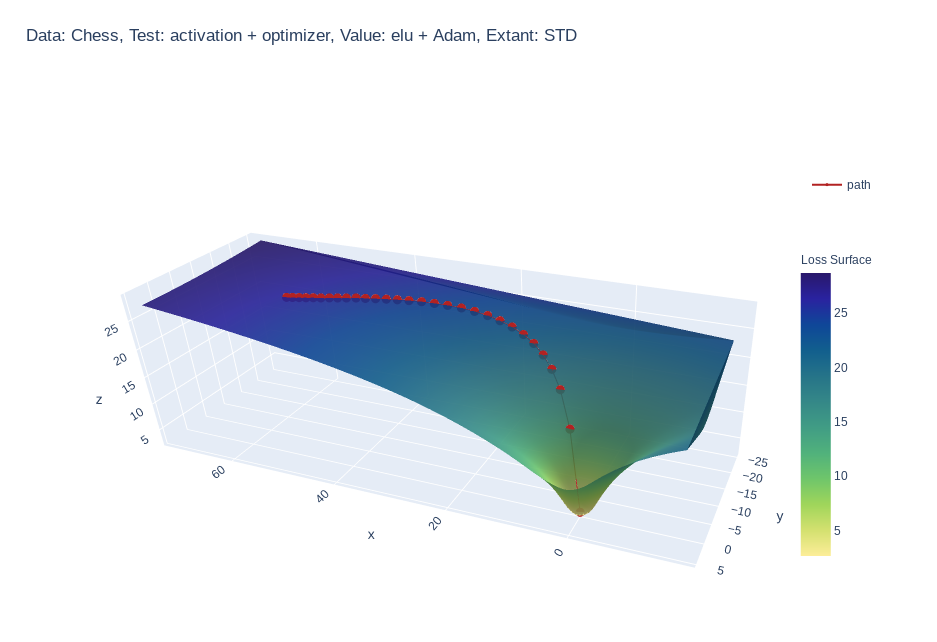
Create 3d loss surface visualizations, with optimizer path. Issues welcome!

MLVTK A loss surface visualization tool Simple feed-forward network trained on chess data, using elu activation and Adam optimizer Simple feed-forward

Fastest Gephi's ForceAtlas2 graph layout algorithm implemented for Python and NetworkX

ForceAtlas2 for Python A port of Gephi's Force Atlas 2 layout algorithm to Python 2 and Python 3 (with a wrapper for NetworkX and igraph). This is the

The visual framework is designed on the idea of module and implemented by mixin method

Visual Framework The visual framework is designed on the idea of module and implemented by mixin method. Its biggest feature is the mixins module whic

Simple plotting for Python. Python wrapper for D3xter - render charts in the browser with simple Python syntax.

PyDexter Simple plotting for Python. Python wrapper for D3xter - render charts in the browser with simple Python syntax. Setup $ pip install PyDexter

Visual Python is a GUI-based Python code generator, developed on the Jupyter Notebook environment as an extension.

Visual Python is a GUI-based Python code generator, developed on the Jupyter Notebook environment as an extension.

A Python Binder that merge 2 files with any extension by creating a new python file and compiling it to exe which runs both payloads.

Update ! ANONFILE MIGHT NOT WORK ! About A Python Binder that merge 2 files with any extension by creating a new python file and compiling it to exe w

Declarative statistical visualization library for Python

Altair http://altair-viz.github.io Altair is a declarative statistical visualization library for Python. With Altair, you can spend more time understa

Interactive Data Visualization in the browser, from  Python
Interactive Data Visualization in the browser, from Python

Bokeh is an interactive visualization library for modern web browsers. It provides elegant, concise construction of versatile graphics, and affords hi

Releases(v0.1)
These data visualizations were created for my introductory computer science course using Python

Homework 2: Matplotlib and Data Visualization Overview These data visualizations were created for my introductory computer science course using Python

Sophia Huang 12 Oct 20, 2022
A grammar of graphics for Python

plotnine Latest Release License DOI Build Status Coverage Documentation plotnine is an implementation of a grammar of graphics in Python, it is based

Hassan Kibirige 3.3k Jan 01, 2023
A python script editor for napari based on PyQode.

napari-script-editor A python script editor for napari based on PyQode. This napari plugin was generated with Cookiecutter using with @napari's cookie

Robert Haase 9 Sep 20, 2022
Geocoding library for Python.

geopy geopy is a Python client for several popular geocoding web services. geopy makes it easy for Python developers to locate the coordinates of addr

geopy 3.8k Jan 02, 2023
Graphical display tools, to help students debug their class implementations in the Carcassonne family of projects

carcassonne_tools Graphical display tools, to help students debug their class implementations in the Carcassonne family of projects NOTE NOTE NOTE The

1 Nov 08, 2021
Mathematical learnings with Lean, for those of us who wish we knew more of both!

Lean for the Inept Mathematician This repository contains source files for a number of articles or posts aimed at explaining bite-sized mathematical c

Julian Berman 8 Feb 14, 2022
This is a web application to visualize various famous technical indicators and stocks tickers from user

Visualizing Technical Indicators Using Python and Plotly. Currently facing issues hosting the application on heroku. As soon as I am able to I'll like

4 Aug 04, 2022
In-memory Graph Database and Knowledge Graph with Natural Language Interface, compatible with Pandas

CogniPy for Pandas - In-memory Graph Database and Knowledge Graph with Natural Language Interface Whats in the box Reasoning, exploration of RDF/OWL,

Cognitum Octopus 34 Dec 13, 2022
Personal IMDB Graphs with Bokeh

Personal IMDB Graphs with Bokeh Do you like watching movies and also rate all of them in IMDB? Would you like to look at your IMDB stats based on your

2 Dec 15, 2021
Python wrapper for Synoptic Data API. Retrieve data from thousands of mesonet stations and networks. Returns JSON from Synoptic as Pandas DataFrame

☁ Synoptic API for Python (unofficial) The Synoptic Mesonet API (formerly MesoWest) gives you access to real-time and historical surface-based weather

Brian Blaylock 23 Jan 06, 2023
Data-FX is an addon for Blender (2.9) that allows for the visualization of data with different charts

Data-FX Data-FX is an addon for Blender (2.9) that allows for the visualization of data with different charts Currently, there are only 2 chart option

Landon Ferguson 20 Nov 21, 2022
It's an application to calculate I from v and r. It can also plot a graph between V vs I.

Ohm-s-Law-Visualizer It's an application to calculate I from v and r using Ohm's Law. It can also plot a graph between V vs I. Story I'm doing my Unde

Sihab Sahariar 1 Nov 20, 2021
These data visualizations were created as homework for my CS40 class. I hope you enjoy!

Data Visualizations These data visualizations were created as homework for my CS40 class. I hope you enjoy! Nobel Laureates by their Country of Birth

9 Sep 02, 2022
Leyna's Visualizing Data With Python

Leyna's Visualizing Data Below is information on the number of bilingual students in three school districts in Massachusetts. You will also find infor

11 Oct 28, 2021
Boltzmann visualization - Visualize the Boltzmann distribution for simple quantum models of molecular motion

Boltzmann visualization - Visualize the Boltzmann distribution for simple quantum models of molecular motion

1 Jan 22, 2022
This is a small repository for me to implement my simply Data Visualisation skills through Python.

Data Visualisations This is a small repository for me to implement my simply Data Visualisation skills through Python. Steam Population Chart from 10/

9 Dec 31, 2021
Pretty Confusion Matrix

Pretty Confusion Matrix Why pretty confusion matrix? We can make confusion matrix by using matplotlib. However it is not so pretty. I want to make con

Junseo Ko 5 Nov 22, 2022
Certificate generating and sending system written in Python.

Certificate Generator & Sender How to use git clone https://github.com/saadhaxxan/Certificate-Generator-Sender.git cd Certificate-Generator-Sender Add

Saad Hassan 11 Dec 01, 2022
Implementation of SOMs (Self-Organizing Maps) with neighborhood-based map topologies.

py-self-organizing-maps Simple implementation of self-organizing maps (SOMs) A SOM is an unsupervised method for learning a mapping from a discrete ne

Jonas Grebe 6 Nov 22, 2022
Visualise top-rated GitHub repositories in a barchart by keyword

This python script was written for simple purpose -- to visualise top-rated GitHub repositories in a barchart by keyword. Script generates html-page with barchart and information about repository own

Cur1iosity 2 Feb 07, 2022