Functions for easily making publication-quality figures with matplotlib.

Overview

Data-viz utils 📈

Functions for data visualization in matplotlib

📚 API

Can be installed using pip install dvu and then imported with import dvu.

You can also just copy the relatively short source code for the functions (easily viewable here).

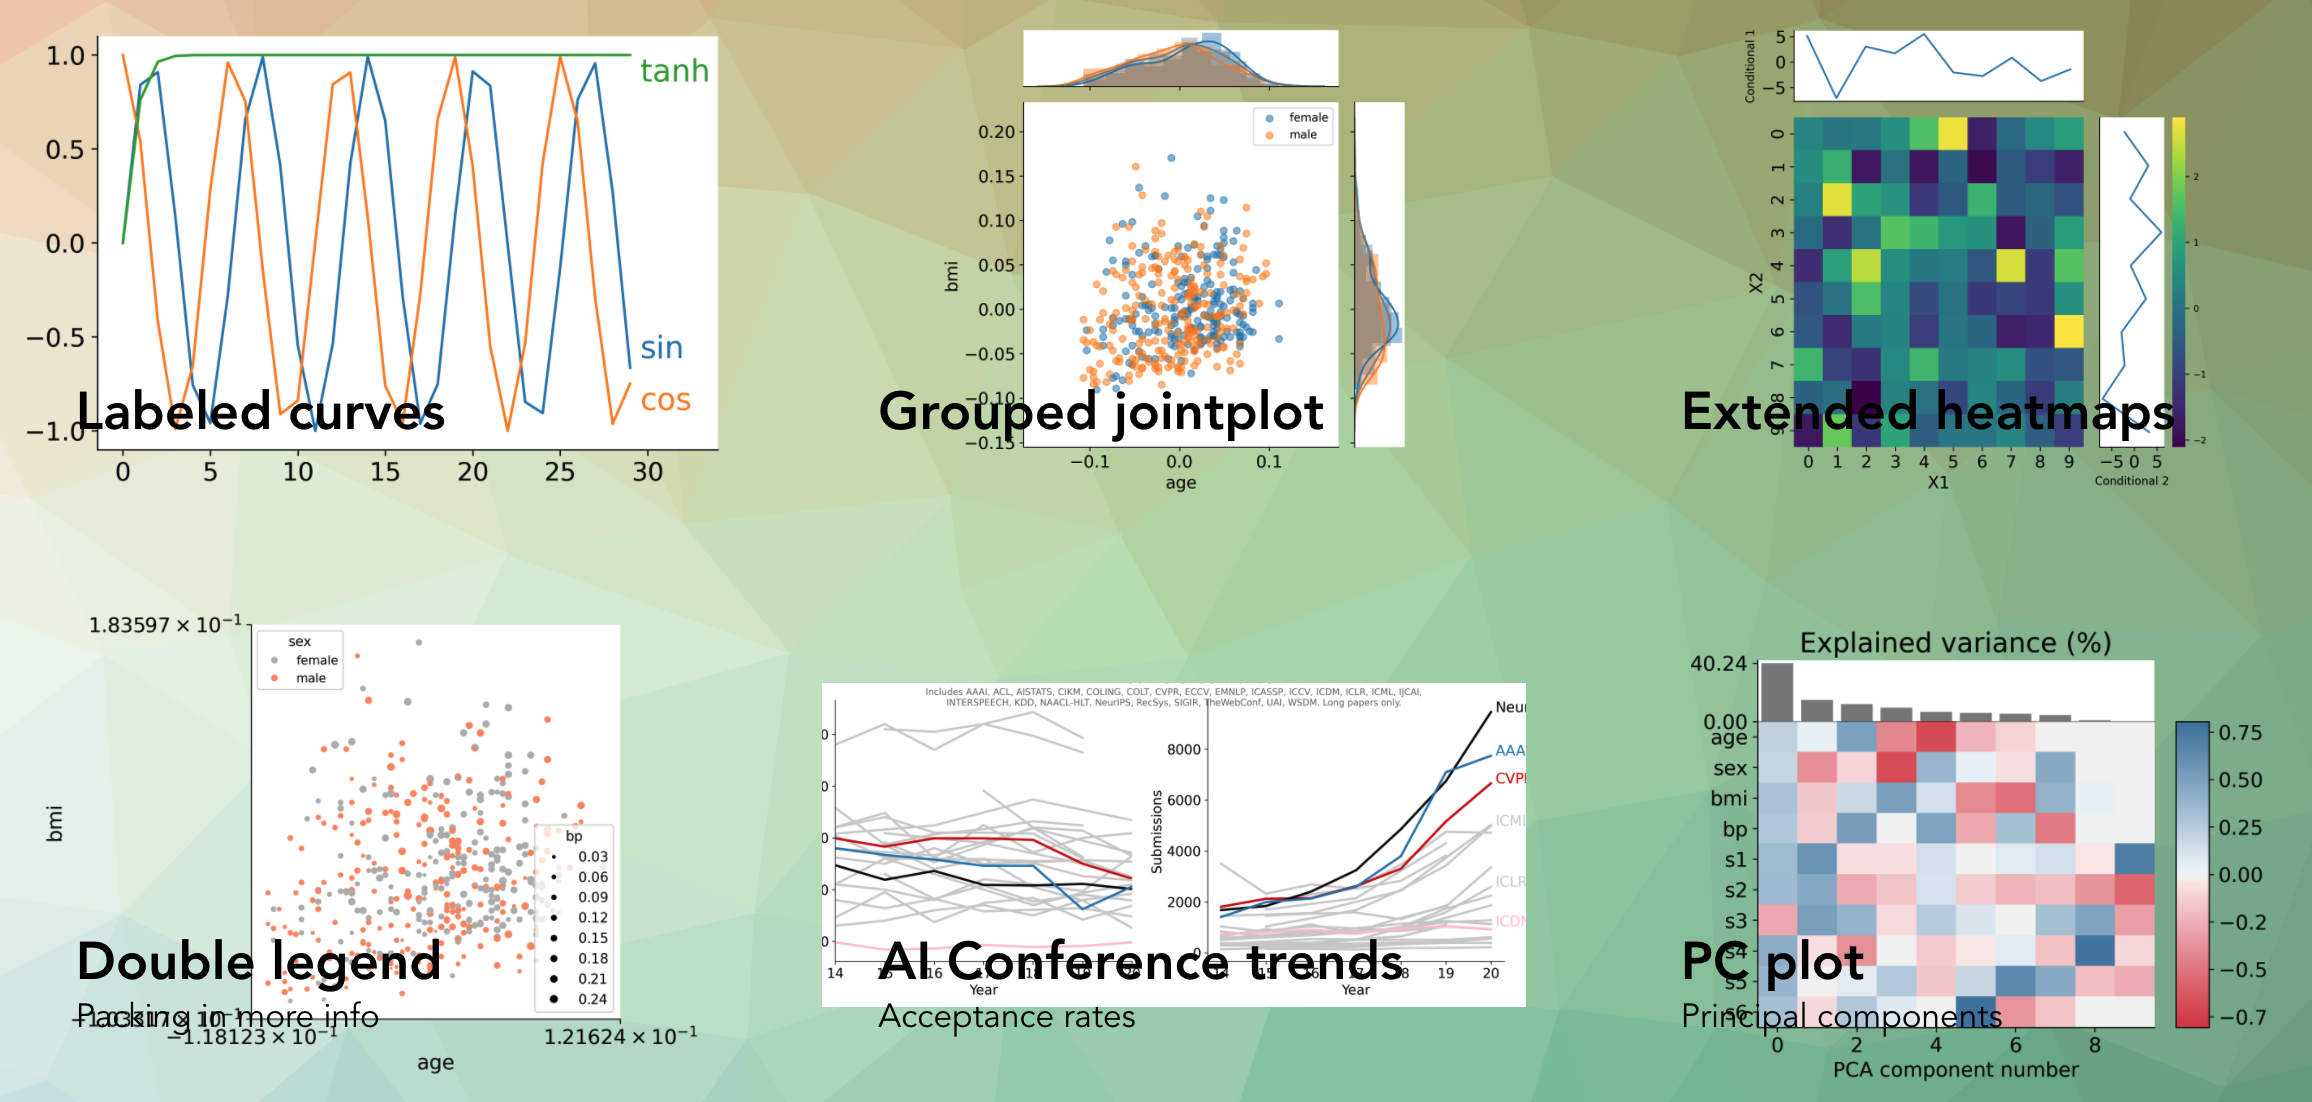
Helps create a bunch of different plots such as these:

One particularly useful function is dvu.line_legend() which replaces a typical matplotlib legend with labels for each line:

Using plt.legend() Using dvu.line_legend()
plt_legend dvu_legend

Another one is dvu.invert_plot() which can be called after generating a plot to invert everything besides the line colors

Original plot After dvu.invert_plot()
plt_legend dvu_legend

Reference

Owner
Chandan Singh
Working on interpretable machine learning across domains 🧠⚕️🦠 Let's do good with models.
Chandan Singh
Print matplotlib colors

mplcolors Tired of searching "matplotlib colors" every week/day/hour? This simple script displays them all conveniently right in your terminal emulato

Brandon Barker 32 Dec 13, 2022
Fast 1D and 2D histogram functions in Python

About Sometimes you just want to compute simple 1D or 2D histograms with regular bins. Fast. No nonsense. Numpy's histogram functions are versatile, a

Thomas Robitaille 237 Dec 18, 2022
Interactive Dashboard for Visualizing OSM Data Change

Dashboard and intuitive data downloader for more interactive experience with interpreting osm change data.

1 Feb 20, 2022
Open-questions - Open questions for Bellingcat technical contributors

Open questions for Bellingcat technical contributors These are difficult, long-term projects that would contribute to open source investigations at Be

Bellingcat 234 Dec 31, 2022
An interactive dashboard for visualisation, integration and classification of data using Active Learning.

AstronomicAL An interactive dashboard for visualisation, integration and classification of data using Active Learning. AstronomicAL is a human-in-the-

45 Nov 28, 2022
It's an application to calculate I from v and r. It can also plot a graph between V vs I.

Ohm-s-Law-Visualizer It's an application to calculate I from v and r using Ohm's Law. It can also plot a graph between V vs I. Story I'm doing my Unde

Sihab Sahariar 1 Nov 20, 2021
A command line tool for visualizing CSV/spreadsheet-like data

PerfPlotter Read data from CSV files using pandas and generate interactive plots using bokeh, which can then be embedded into HTML pages and served by

Gino Mempin 0 Jun 25, 2022
Python toolkit for defining+simulating+visualizing+analyzing attractors, dynamical systems, iterated function systems, roulette curves, and more

Attractors A small module that provides functions and classes for very efficient simulation and rendering of iterated function systems; dynamical syst

1 Aug 04, 2021
Python Data Structures for Humans™.

Schematics Python Data Structures for Humans™. About Project documentation: https://schematics.readthedocs.io/en/latest/ Schematics is a Python librar

Schematics 2.5k Dec 28, 2022
Set of matplotlib operations that are not trivial

Matplotlib Snippets This repository contains a set of matplotlib operations that are not trivial. Histograms Histogram with bins adapted to log scale

Raphael Meudec 1 Nov 15, 2021
D-Analyst : High Performance Visualization Tool

D-Analyst : High Performance Visualization Tool D-Analyst is a high performance data visualization built with python and based on OpenGL. It allows to

4 Apr 14, 2022
Decision Border Visualizer for Classification Algorithms

dbv Decision Border Visualizer for Classification Algorithms Project description A python package for Machine Learning Engineers who want to visualize

Sven Eschlbeck 1 Nov 01, 2021
Rockstar - Makes you a Rockstar C++ Programmer in 2 minutes

Rockstar Rockstar is one amazing library, which will make you a Rockstar Programmer in just 2 minutes. In last decade, people learned C++ in 21 days.

4k Jan 05, 2023
Graphical display tools, to help students debug their class implementations in the Carcassonne family of projects

carcassonne_tools Graphical display tools, to help students debug their class implementations in the Carcassonne family of projects NOTE NOTE NOTE The

1 Nov 08, 2021
Simple implementation of Self Organizing Maps (SOMs) with rectangular and hexagonal grid topologies

py-self-organizing-map Simple implementation of Self Organizing Maps (SOMs) with rectangular and hexagonal grid topologies. A SOM is a simple unsuperv

Jonas Grebe 1 Feb 10, 2022
Gesture controlled media player

Media Player Gesture Control Gesture controller for media player with MediaPipe, VLC and OpenCV. Contents About Setup About A tool for using gestures

Atharva Joshi 2 Dec 22, 2021
ScisorWiz: Differential Isoform Visualizer for Long-Read RNA Sequencing Data

ScisorWiz: Vizualizer for Differential Isoform Expression README ScisorWiz is a linux-based R-package for visualizing differential isoform expression

Alexander Stein 6 Oct 04, 2022
simple tool to paint axis x and y

simple tool to paint axis x and y

G705 1 Oct 21, 2021
Piglet-shaders - PoC of custom shaders for Piglet

Piglet custom shader PoC This is a PoC for compiling Piglet fragment shaders usi

6 Mar 10, 2022
Pretty Confusion Matrix

Pretty Confusion Matrix Why pretty confusion matrix? We can make confusion matrix by using matplotlib. However it is not so pretty. I want to make con

Junseo Ko 5 Nov 22, 2022