Package managers visualization

Related tags

Data Visualizationpm
Overview

Software Galaxies

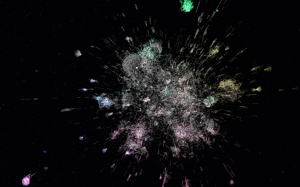
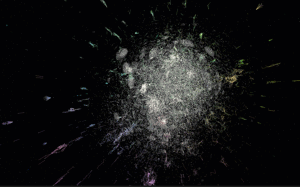
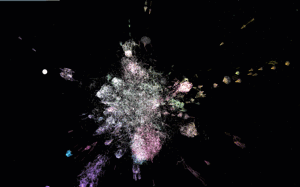
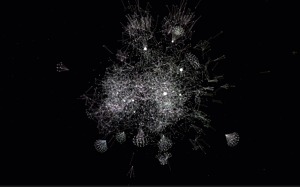
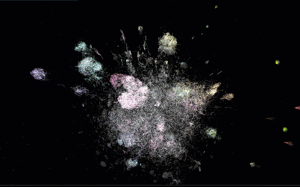
This repository combines visualizations of major software package managers.

All visualizations are available here: http://anvaka.github.io/pm/#/

Please read operating manual - it is short and describes basic navigation principles.

Repository was create for my talk at CascadiaJS 2015

After conference update - video - slides

Friends, you are awesome! I can't express how much I appreciate all your kind words and warm feedback. It really means a world for me. Thank you!

Individual Visualizations

Each graph is indexed individually, and data is pushed to gh-pages branch of galactic-data.

Bower
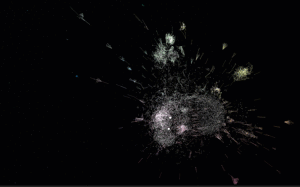

indexer | demo

PHP Composer


indexer | demo

Ruby gems


indexer | demo

npm


indexer | demo

Go


indexer | demo

R language


indexer | demo

Debian


indexer | demo

Arch Linux


indexer | demo

Arch Linux + AUR


indexer | demo

NuGet


indexer | demo

Homebrew


indexer | demo

PyPI


indexer | demo

Fedora


indexer | demo

Rust Crates


indexer | demo

Elm


indexer | demo

local development

git clone https://github.com/anvaka/pm
cd pm
npm i
npm start

This will start local development sever with auto-rebuild.

Your own graphs

This section has detailed instructions about how to use the tool with your own graphs. Before you read any further, if your graph is smaller than 10k nodes, consider using ngraph.pixel or VivaGraph both should be able to provide interactive layout.

If you have an interesting graph but don't have JavaScript experience, please feel free to reach out to me and I'll try to make visualization for you (my email is [email protected]).

Otherwise, if you want to hack on your own, please keep reading.

Graph

First, you will need a graph in ngraph.graph format. The ngraph.graph has detailed documentation about how to create graph, but it also has several loaders from popular graph formats (e.g. dot, gexf)

Layout

Now that you have a graph we need to compute the layout.

If your graph is smaller than 200k nodes, consider using ngraph.offline.layout. This module was created exactly for the purpose of the pm project, it is well documented, and should be easy to get started with. You can also read layout.js of all[gems|go|bower] packages to see more examples.

If your graph is much larger than 200k nodes, then consider using ngraph.native - this module is harder to work with (as it requires C++ knowledge), but it is much faster.

The secret GitHub visualization is using ngraph.native.

Data format

Once layout is computed, we are ready to visualize. Just save the graph using ngraph.tobinary and store it along with latest positions file (produced by layout) into a folder.

The folder structure should look like this:

.
└── my-pm-data-server
    └── my-graph
        ├── manifest.json
        └── version-1
            ├── labels.json         /* this file is produced by ngraph.tobinary */
            ├── links.bin           /* this file is produced by ngraph.tobinary */
            └── positions.bin       /* this file is produced by ngraph.native   */

The file manifest.json describes what version of the graph are available and has the following content:

{
  "all": ["version-1"],
  "last": "version-1"
}

Inside my-pm-data-server we launch a web server. I personally prefer http-server. Once it is installed globally (npm i http-server -g), you can launch it like this:

http-server --cors -p 9090

This will start a local data server at http://127.0.0.1:9090/

Update the config.js in this repository to point to your data server, and your graph should be accessible at

http://127.0.0.1:8081/#/galaxy/my-graph

Note

The galactic-data follows the same data structure as described above. Use it for the reference if you need an example

The secret visualization

The last shown visualization was secret GitHub followers visualization. It shows all GitHub users who has more than two followers.

The visualization has more than 1,100,000 nodes, and renders at 60 fps when flying around. The FPS drops when you hover-over nodes to 20-30, This is because we are doing hit-testing, to find what's under cursor.

With this many nodes, it runs well in the browser. Unfortunately it requires more than 1GB of RAM. Which may or may not crash your phone browser - sorry about this.

With all warnings said, here are the links:

Feedback

Please do not hesitate to provide your feedback or bug fixes. Even if it is something small like fixing a typo - I'd be glad to hear from you!

Owner
Andrei Kashcha
I love graphs
Andrei Kashcha
Smarthome Dashboard with Grafana & InfluxDB

Smarthome Dashboard with Grafana & InfluxDB This is a complete overhaul of my Raspberry Dashboard done with Flask. I switched from sqlite to InfluxDB

6 Oct 20, 2022
Create a visualization for Trump's Tweeted Words Using Python

Data Trump's Tweeted Words This plot illustrates twitter word occurences. We already did the coding I needed for this plot, so I was very inspired to

7 Mar 27, 2022
Library for exploring and validating machine learning data

TensorFlow Data Validation TensorFlow Data Validation (TFDV) is a library for exploring and validating machine learning data. It is designed to be hig

688 Jan 03, 2023
100 data puzzles for pandas, ranging from short and simple to super tricky (60% complete)

100 pandas puzzles Puzzles notebook Solutions notebook Inspired by 100 Numpy exerises, here are 100* short puzzles for testing your knowledge of panda

Alex Riley 1.9k Jan 08, 2023
Matplotlib JOTA style for making figures

Matplotlib JOTA style for making figures This repo has Matplotlib JOTA style to format plots and figures for publications and presentation.

JOTA JORNALISMO 2 May 05, 2022
Fastest Gephi's ForceAtlas2 graph layout algorithm implemented for Python and NetworkX

ForceAtlas2 for Python A port of Gephi's Force Atlas 2 layout algorithm to Python 2 and Python 3 (with a wrapper for NetworkX and igraph). This is the

Bhargav Chippada 227 Jan 05, 2023
GitHubPoster - Make everything a GitHub svg poster

GitHubPoster Make everything a GitHub svg poster 支持 Strava 开心词场 扇贝 Nintendo Switch GPX 多邻国 Issue

yihong 1.3k Jan 02, 2023
A visualization tool made in Pygame for various pathfinding algorithms.

Pathfinding-Visualizer 🚀 A visualization tool made in Pygame for various pathfinding algorithms. Pathfinding is closely related to the shortest path

Aysha sana 7 Jul 09, 2022
A Python Binder that merge 2 files with any extension by creating a new python file and compiling it to exe which runs both payloads.

Update ! ANONFILE MIGHT NOT WORK ! About A Python Binder that merge 2 files with any extension by creating a new python file and compiling it to exe w

Vesper 15 Oct 12, 2022
Quickly and accurately render even the largest data.

Turn even the largest data into images, accurately Build Status Coverage Latest dev release Latest release Docs Support What is it? Datashader is a da

HoloViz 2.9k Dec 28, 2022
Graphical display tools, to help students debug their class implementations in the Carcassonne family of projects

carcassonne_tools Graphical display tools, to help students debug their class implementations in the Carcassonne family of projects NOTE NOTE NOTE The

1 Nov 08, 2021
This tool is designed to help administrators get an overview of their Active Directory structure.

This tool is designed to help administrators get an overview of their Active Directory structure. In the group view you can see all elements of an AD (OU, USER, GROUPS, COMPUTERS etc.). In the user v

deexno 2 Oct 30, 2022
Kglab - an abstraction layer in Python for building knowledge graphs

Graph Data Science: an abstraction layer in Python for building knowledge graphs, integrated with popular graph libraries – atop Pandas, RDFlib, pySHACL, RAPIDS, NetworkX, iGraph, PyVis, pslpython, p

derwen.ai 466 Jan 09, 2023
Visualization of hidden layer activations of small multilayer perceptrons (MLPs)

MLP Hidden Layer Activation Visualization To gain some intuition about the internal representation of simple multi-layer perceptrons (MLPs) I trained

Andreas Köpf 7 Dec 30, 2022
Productivity Tools for Plotly + Pandas

Cufflinks This library binds the power of plotly with the flexibility of pandas for easy plotting. This library is available on https://github.com/san

Jorge Santos 2.7k Dec 30, 2022
股票行情实时数据接口-A股,完全免费的沪深证券股票数据-中国股市,python最简封装的API接口

股票行情实时数据接口-A股,完全免费的沪深证券股票数据-中国股市,python最简封装的API接口,包含日线,历史K线,分时线,分钟线,全部实时采集,系统包括新浪腾讯双数据核心采集获取,自动故障切换,STOCK数据格式成DataFrame格式,可用来查询研究量化分析,股票程序自动化交易系统.为量化研究者在数据获取方面极大地减轻工作量,更加专注于策略和模型的研究与实现。

dev 572 Jan 08, 2023
A python script editor for napari based on PyQode.

napari-script-editor A python script editor for napari based on PyQode. This napari plugin was generated with Cookiecutter using with @napari's cookie

Robert Haase 9 Sep 20, 2022
An interactive GUI for WhiteboxTools in a Jupyter-based environment

whiteboxgui An interactive GUI for WhiteboxTools in a Jupyter-based environment GitHub repo: https://github.com/giswqs/whiteboxgui Documentation: http

Qiusheng Wu 105 Dec 15, 2022
JupyterHub extension for ContainDS Dashboards

ContainDS Dashboards for JupyterHub A Dashboard publishing solution for Data Science teams to share results with decision makers. Run a private on-pre

Ideonate 179 Nov 29, 2022
clock_plot provides a simple way to visualize timeseries data, mapping 24 hours onto the 360 degrees of a polar plot

clock_plot clock_plot provides a simple way to visualize timeseries data mapping 24 hours onto the 360 degrees of a polar plot. For usage, please see

12 Aug 24, 2022