Visualize the bitcoin blockchain from your local node

Overview

Project Overview

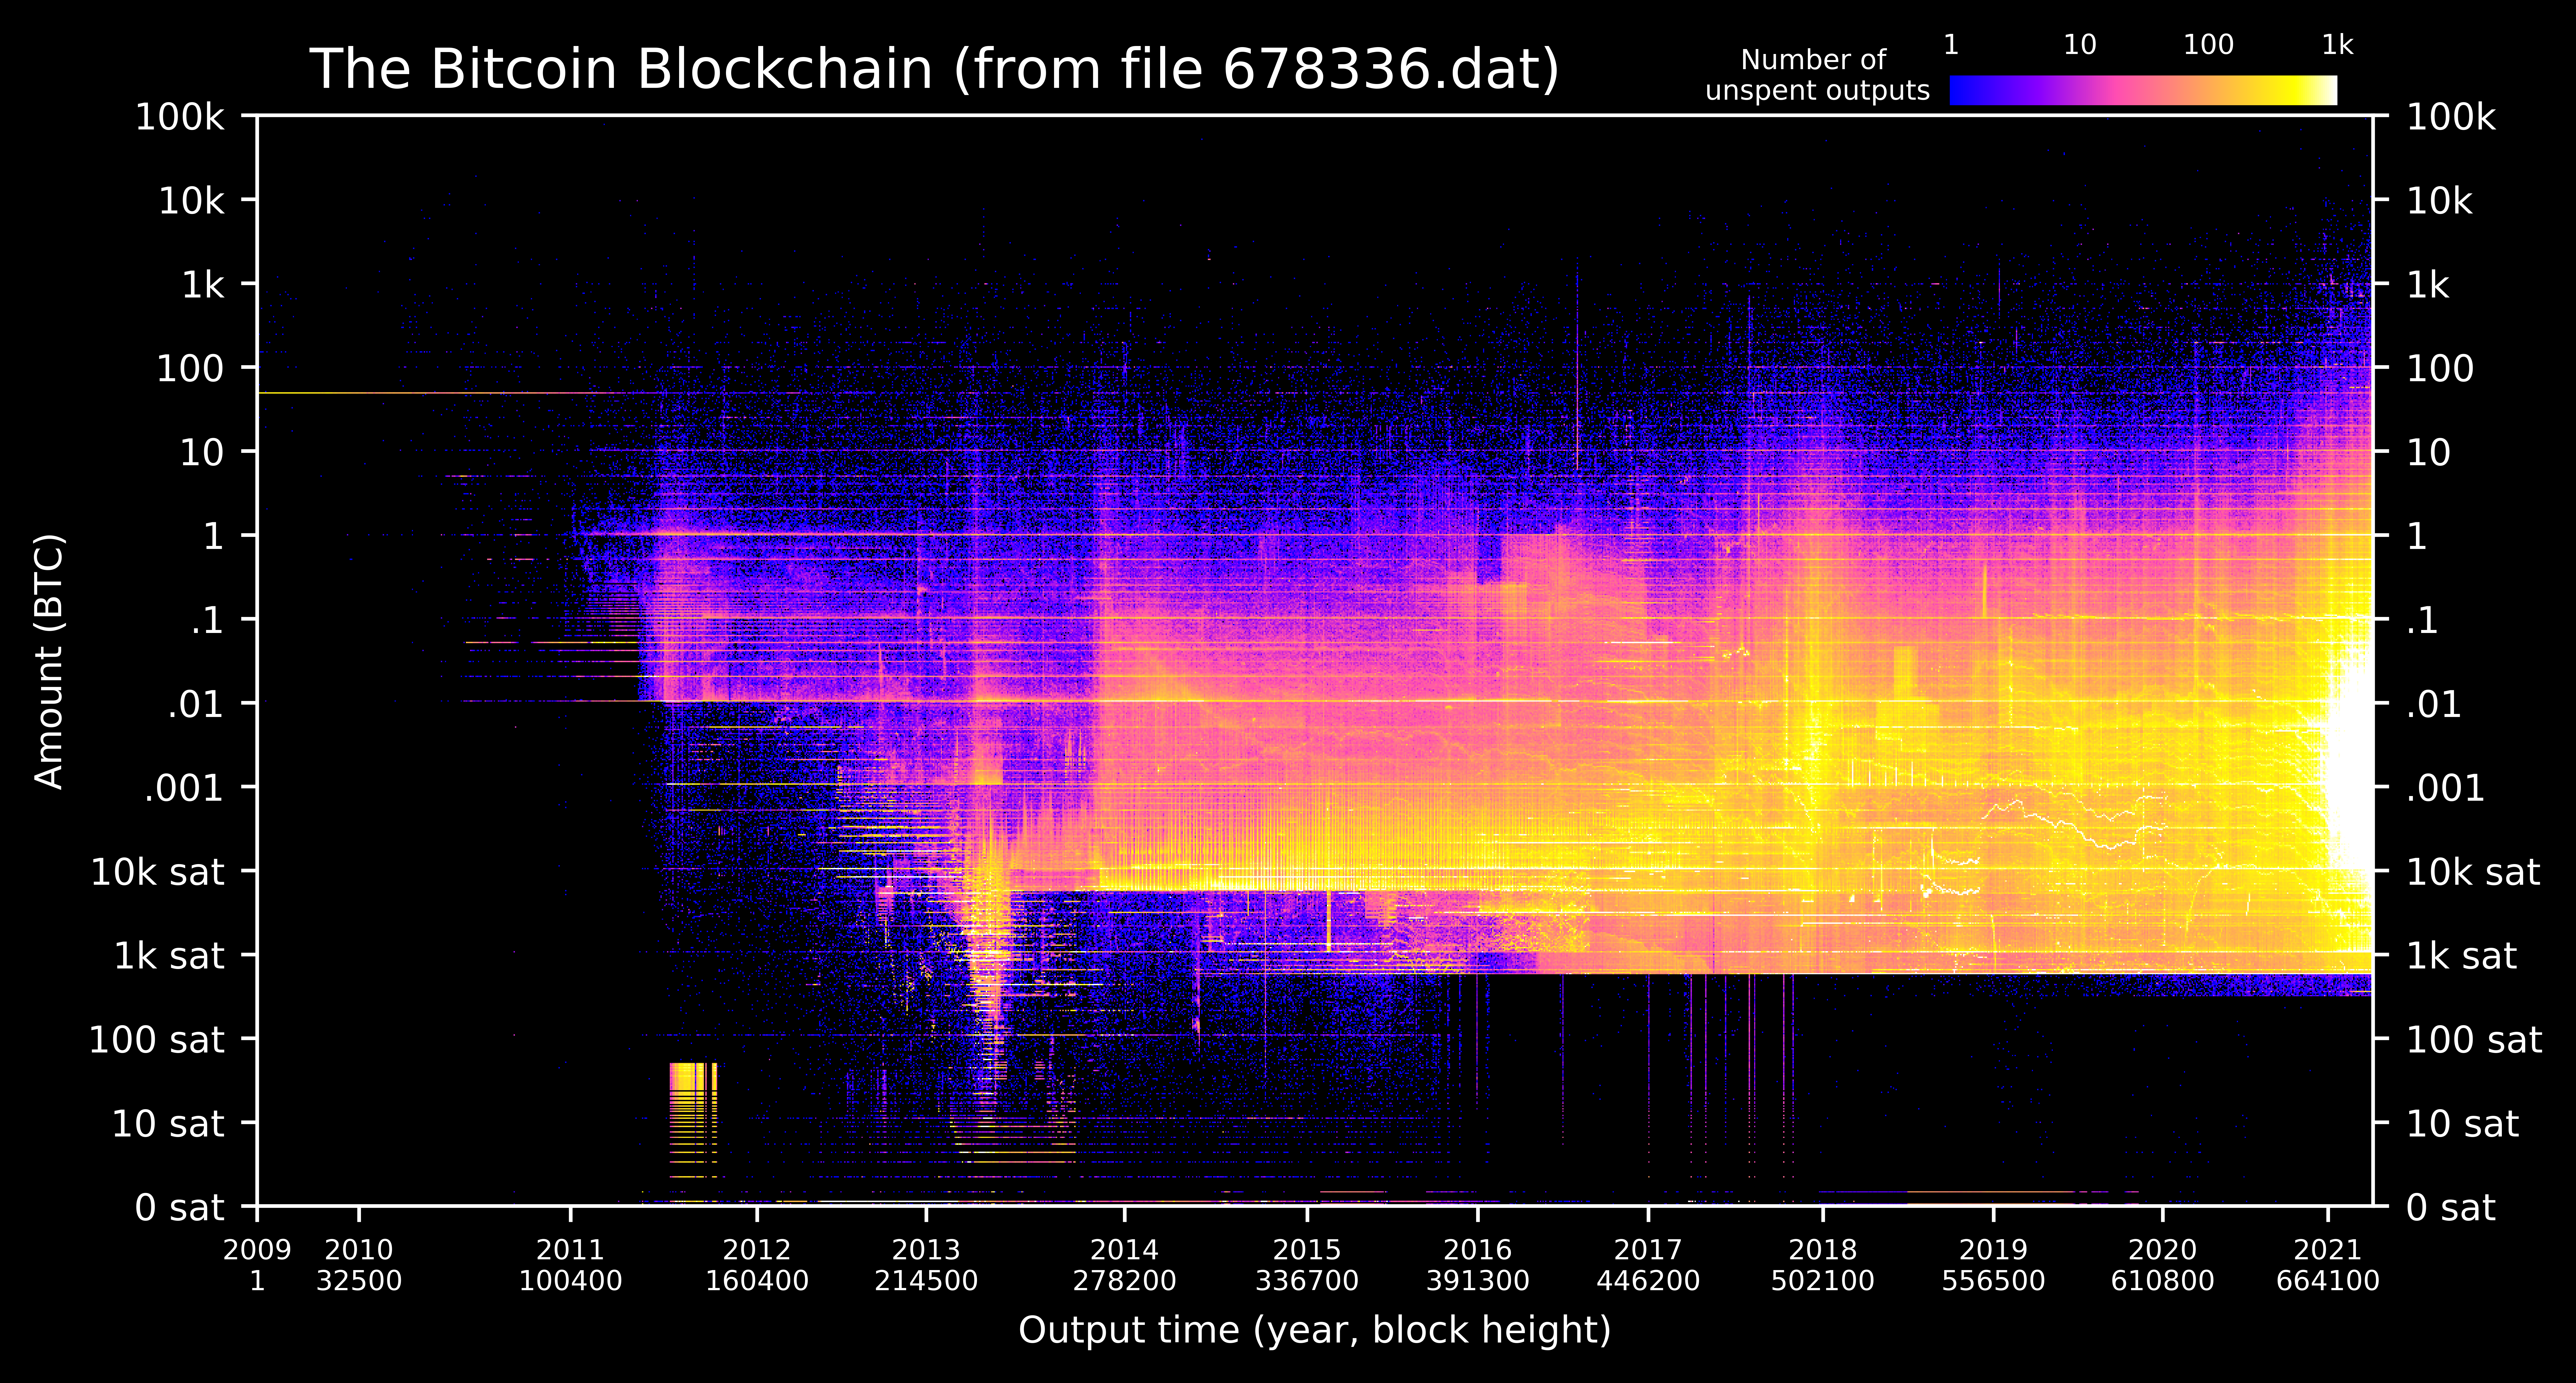
A new feature in Bitcoin Core 0.20 allows users to dump the state of the blockchain (the UTXO set) using the command dumptxoutset. I've written a python script utxo-live.py that takes the ouput of dumptxoutset and generates a heatmap of the blockchain via the UTXO set. Thus all of the active bitcoin in the blockchain is visualized in a single image from your own node.


Logo

Figure description: The heatmap is a two dimensional histogram showing the output date (x-axis), BTC amount (y-axis), and number of unspent outputs (color map) in each histogram bin. The BTC amounts on the y-axis are log scale and there are 100 bins in each log decade (e.g. 100 bins between 1 and 10 BTC). The bin size of output dates is one day. Zooming in to the image usually reveals more detail. A daily updating version of this image is running at utxo.live.

Privacy & Security

With the new dumptxouset command, the python script no longer requires an RPC password to access Core's databases. The script simply reads the dump file without interacting with Core at all. No private keys, passwords, xpubs, or wallet addresses are exchanged between Core and the python script.

Requirements

  • Bitcoin Core version 0.20 or higher
  • Python3 (comes standard on all operating systems)

Instructions for experienced users

  • Create a folder called utxo-live in a familiar location
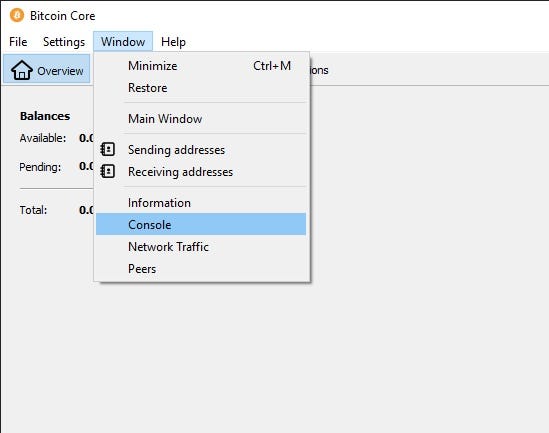
  • Dump the utxo set bitcoin-cli dumptxoutset /xxxxxx.dat where xxxxxxx is the current block height (10-20 min) (Note: bitcoin-cli doesn't ship with Core on Mac OS, use Window->Console instead)
  • Install two python dependencies python3 -m pip install numpy matplotlib
  • Download utxo-live.py to your utxo-live folder and run it python3 utxo-live.py (20 min)

Step by step instructions

  1. Make sure Bitcoin Core (version 0.20 or higher) is running and synchronized.

  2. Create a new folder called utxo-live in a familiar location on your machine (e.g. in your Documents folder).

  3. Open a terminal window and display the current folder path. Do this by:

  • Windows: open a terminal (Start -> Command Prompt) and type:
echo %cd%
  • Mac/Linux: open a terminal (Mac: Applications -> Utilities -> Terminal) and type:
pwd
  1. Navigate to the utxo-live folder using the change directory cd command. For example if you're currently in Users/Steve/ (or on Windows C:\Users\Steve\) and you've created the folder Steve/Documents/bitcoin-tools/utxo-live/ then type:
cd Document/bitcoin-tools/utxo-live/

Note: Windows sometimes requires forward slashes / instead of back slashes \.

  1. Again display the current folder (Step 3) and copy to your clipboard the full path to the utxo-live folder. We will be pasting this path into Bitcoin Core soon.

  2. Leave the terminal window momentarily, and open the Bitcoin Core console window. (Alternatively for bitcoin-cli users, open another terminal window and type the console commands in the next steps as bitcoin-cli commands.)

Open Console Pic

  1. Get the current block count by typing in the console window:
getblockcount

and hitting enter. The output will look like:

  1. Dump the current utxo set by typing in the console window:
  dumptxoutset <PATH to utxo-live>/<xxxxxx.dat>

where is copy-pasted from Step 5, and is the block count. For example if the block count is 678505, the command (for my path) is:

  dumptxoutset /Users/Steve/Documents/bitcoin-tools/utxo-live/678505.dat

If there are no error messages after hitting enter, then it's working. It will take 10-20 minutes. Look in your utxo-live folder and you should see the file being created as xxxxxx.dat.incomplete.

  1. While the utxo file is dumping, download utxo-live.py and install two python dependencies. To do this:
  • Right click on utxo-live.py, choose "Save Link As" and select the utxo-live folder.

  • In the terminal window (not the Bitcoin console), type the following command to install two python dependencies:

  python3 -m pip install numpy matplotlib

Note: you might already have these installed, but running the command won't hurt anything.

  1. If 10-20 minutes have passed, check that the utxo dump is completed. Do this in two ways:
  • Check that the file no longer has .incomplete after xxxxxx.dat
  • Check that the Bitcoin Core console displays the results of the dump as something like:

  1. If the dump file is finished and Step 9 is completed (utxo-live.py is downloaded and python dependencies were installed), then run utxo-live.py by typing in the terminal:
  python3 utxo-live.py
  1. The program will take 20-30 minutes to complete and it will update you on the progress. If there are multiple xxxxxxx.dat files in the folder, it will ask you which one you'd like to process. When finished the image is stored in the folder as utxo_heatmap_xxxxxx.png.

Acknowledgements

I'm indebted to three main projects for the code, understanding, and inspiration for this project. The python functions that parse and decode the utxo dump file were adapted from Bitcoin_Tools. I learned how Core serializes utxos from Bitcoin-UTXO-Dump . An inspiring project that visualizes changes in the UTXO set as a movie is BitcoinUtxoVisualizer .
A Python library for plotting hockey rinks with Matplotlib.

Hockey Rink A Python library for plotting hockey rinks with Matplotlib. Installation pip install hockey_rink Current Rinks The following shows the cus

24 Jan 02, 2023
An interactive dashboard for visualisation, integration and classification of data using Active Learning.

AstronomicAL An interactive dashboard for visualisation, integration and classification of data using Active Learning. AstronomicAL is a human-in-the-

45 Nov 28, 2022
DataVisualization - The evolution of my arduino and python journey. New level of competence achieved

DataVisualization - The evolution of my arduino and python journey. New level of competence achieved

1 Jan 03, 2022
This is a learning tool and exploration app made using the Dash interactive Python framework developed by Plotly

Support Vector Machine (SVM) Explorer This app has been moved here. This repo is likely outdated and will not be updated. This is a learning tool and

Plotly 150 Nov 03, 2022
Debugging, monitoring and visualization for Python Machine Learning and Data Science

Welcome to TensorWatch TensorWatch is a debugging and visualization tool designed for data science, deep learning and reinforcement learning from Micr

Microsoft 3.3k Dec 27, 2022
View part of your screen in grayscale or simulated color vision deficiency.

monolens View part of your screen in grayscale or filtered to simulate color vision deficiency. Watch the demo on YouTube. Install with pip install mo

Hans Dembinski 31 Oct 11, 2022
A curated list of awesome Dash (plotly) resources

Awesome Dash A curated list of awesome Dash (plotly) resources Dash is a productive Python framework for building web applications. Written on top of

Luke Singham 1.7k Dec 26, 2022
Python & Julia port of codes in excellent R books

X4DS This repo is a collection of Python & Julia port of codes in the following excellent R books: An Introduction to Statistical Learning (ISLR) Stat

Gitony 5 Jun 21, 2022
A python visualization of the A* path finding algorithm

A python visualization of the A* path finding algorithm. It allows you to pick your start, end location and make obstacles and then view the process of finding the shortest path. You can also choose

Kimeon 4 Aug 02, 2022
哔咔漫画window客户端,界面使用PySide2,已实现分类、搜索、收藏夹、下载、在线观看、waifu2x等功能。

picacomic-windows 哔咔漫画window客户端,界面使用PySide2,已实现分类、搜索、收藏夹、下载、在线观看等功能。 功能介绍 登陆分流,还原安卓端的三个分流入口 分类,搜索,排行,收藏夹使用同一的逻辑,滚轮下滑自动加载下一页,双击打开 漫画详情,章节列表和评论列表 下载功能,目

1.8k Dec 31, 2022
This package creates clean and beautiful matplotlib plots that work on light and dark backgrounds

This package creates clean and beautiful matplotlib plots that work on light and dark backgrounds. Inspired by the work of Edward Tufte.

Nico Schlömer 205 Jan 07, 2023
A gui application to visualize various sorting algorithms using pure python.

Sorting Algorithm Visualizer A gui application to visualize various sorting algorithms using pure python. Language : Python 3 Libraries required Tkint

Rajarshi Banerjee 19 Nov 30, 2022
Easily configurable, chart dashboards from any arbitrary API endpoint. JSON config only

Flask JSONDash Easily configurable, chart dashboards from any arbitrary API endpoint. JSON config only. Ready to go. This project is a flask blueprint

Chris Tabor 3.3k Dec 31, 2022
High performance, editable, stylable datagrids in jupyter and jupyterlab

An ipywidgets wrapper of regular-table for Jupyter. Examples Two Billion Rows Notebook Click Events Notebook Edit Events Notebook Styling Notebook Pan

J.P. Morgan Chase 75 Dec 15, 2022
Automatically generate GitHub activity!

Commit Bot Automatically generate GitHub activity! We've all wanted to be the developer that commits every day, but that requires a lot of work. Let's

Ricky 4 Jun 07, 2022
Simple addon for snapping active object to mesh ground

Snap to Ground Simple addon for snapping active object to mesh ground How to install: install the Python file as an addon use shortcut "D" in 3D view

Iyad Ahmed 12 Nov 07, 2022
Mapomatic - Automatic mapping of compiled circuits to low-noise sub-graphs

mapomatic Automatic mapping of compiled circuits to low-noise sub-graphs Overvie

Qiskit Partners 27 Nov 06, 2022
A simple agent-based model used to teach the basics of OOP in my lectures

Pydemic A simple agent-based model of a pandemic. This is used to teach basic principles of object-oriented programming to master students. It is not

Fabien Maussion 2 Jun 08, 2022
Make scripted visualizations in blender

Scripted visualizations in blender The goal of this project is to script 3D scientific visualizations using blender. To achieve this, we aim to bring

Praneeth Namburi 10 Jun 01, 2022
Data Visualizer for Super Mario Kart (SNES)

Data Visualizer for Super Mario Kart (SNES)

MrL314 21 Nov 20, 2022