Python ts2vg package provides high-performance algorithm implementations to build visibility graphs from time series data.

Overview

ts2vg: Time series to visibility graphs

pypi pyversions wheel license

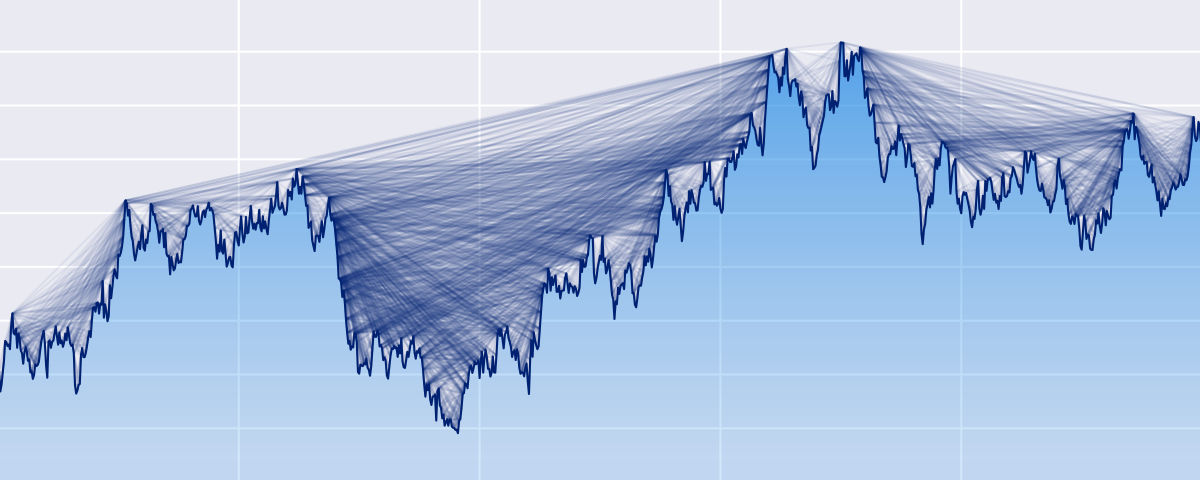
Example plot of a visibility graph


The Python ts2vg package provides high-performance algorithm implementations to build visibility graphs from time series data.

The visibility graphs and some of their properties (e.g. degree distributions) are computed quickly and efficiently, even for time series with millions of observations thanks to the use of NumPy and a custom C backend (via Cython) developed for the visibility algorithms.

The visibility graphs are provided according to the mathematical definitions described in:

  • Lucas Lacasa et al., "From time series to complex networks: The visibility graph", 2008.
  • Lucas Lacasa et al., "Horizontal visibility graphs: exact results for random time series", 2009.

An efficient divide-and-conquer algorithm is used to compute the graphs, as described in:

  • Xin Lan et al., "Fast transformation from time series to visibility graphs", 2015.

Installation

The latest released ts2vg version is available at the Python Package Index (PyPI) and can be easily installed by running:

pip install ts2vg

For other advanced uses, to build ts2vg from source Cython is required.

Basic usage

Visibility graph

Building visibility graphs from time series is very simple:

from ts2vg import NaturalVG

ts = [1.0, 0.5, 0.3, 0.7, 1.0, 0.5, 0.3, 0.8]

g = NaturalVG()
g.build(ts)

edges = g.edges

The time series passed can be a list, a tuple, or a numpy 1D array.

Horizontal visibility graph

We can also obtain horizontal visibility graphs in a very similar way:

from ts2vg import HorizontalVG

ts = [1.0, 0.5, 0.3, 0.7, 1.0, 0.5, 0.3, 0.8]

g = HorizontalVG()
g.build(ts)

edges = g.edges

Degree distribution

If we are only interested in the degree distribution of the visibility graph we can pass only_degrees=True to the build method. This will be more efficient in time and memory than computing the whole graph.

g = NaturalVG()
g.build(ts, only_degrees=True)

ks, ps = g.degree_distribution

Directed visibility graph

g = NaturalVG(directed='left_to_right')
g.build(ts)

Weighted visibility graph

g = NaturalVG(weighted='distance')
g.build(ts)

For more information and options see: Examples and API Reference.

Interoperability with other libraries

The graphs obtained can be easily converted to graph objects from other common Python graph libraries such as igraph, NetworkX and SNAP for further analysis.

The following methods are provided:

  • as_igraph()
  • as_networkx()
  • as_snap()

For example:

g = NaturalVG()
g.build(ts)

nx_g = g.as_networkx()

Command line interface

ts2vg can also be used as a command line program directly from the console:

ts2vg ./timeseries.txt -o out.edg

For more help and a list of options run:

ts2vg --help

Contributing

ts2vg can be found on GitHub. Pull requests and issue reports are welcome.

License

ts2vg is licensed under the terms of the MIT License.

You might also like...
The Spectral Diagram (SD) is a new tool for the comparison of time series in the frequency domain

The Spectral Diagram (SD) is a new tool for the comparison of time series in the frequency domain. The SD provides a novel way to display the coherence function, power, amplitude, phase, and skill score of discrete frequencies of two time series. Each SD summarises these quantities in a single plot for multiple targeted frequencies.

The windML framework provides an easy-to-use access to wind data sources within the Python world, building upon numpy, scipy, sklearn, and matplotlib. Renewable Wind Energy, Forecasting, Prediction

windml Build status : The importance of wind in smart grids with a large number of renewable energy resources is increasing. With the growing infrastr

Kglab - an abstraction layer in Python for building knowledge graphs

Graph Data Science: an abstraction layer in Python for building knowledge graphs, integrated with popular graph libraries – atop Pandas, RDFlib, pySHACL, RAPIDS, NetworkX, iGraph, PyVis, pslpython, pyarrow, etc.

Extensible, parallel implementations of t-SNE

openTSNE openTSNE is a modular Python implementation of t-Distributed Stochasitc Neighbor Embedding (t-SNE) [1], a popular dimensionality-reduction al

Extensible, parallel implementations of t-SNE

openTSNE openTSNE is a modular Python implementation of t-Distributed Stochasitc Neighbor Embedding (t-SNE) [1], a popular dimensionality-reduction al

Graphical display tools, to help students debug their class implementations in the Carcassonne family of projects

carcassonne_tools Graphical display tools, to help students debug their class implementations in the Carcassonne family of projects NOTE NOTE NOTE The

Draw interactive NetworkX graphs with Altair

nx_altair Draw NetworkX graphs with Altair nx_altair offers a similar draw API to NetworkX but returns Altair Charts instead. If you'd like to contrib

Draw interactive NetworkX graphs with Altair

nx_altair Draw NetworkX graphs with Altair nx_altair offers a similar draw API to NetworkX but returns Altair Charts instead. If you'd like to contrib

Generate graphs with NetworkX, natively visualize with D3.js and pywebview

webview_d3 This is some PoC code to render graphs created with NetworkX natively using D3.js and pywebview. The main benifit of this approac

Comments
  • help getting started

    help getting started

    I am playing around with ts2vg and I am having a hard time with the plotting using igraph. I try to compute the natural vg for a short time series, but when trying to plot it I get this error:

    Traceback (most recent call last):
      File "\anaconda3\envs\DK_01\lib\site-packages\IPython\core\interactiveshell.py", line 3398, in run_code
        exec(code_obj, self.user_global_ns, self.user_ns)
      File "<ipython-input-1-9a1fdcf342e8>", line 1, in <cell line: 1>
        ig.plot(nx_g, target='graph.pdf')
      File "\anaconda3\envs\DK_01\lib\site-packages\igraph\drawing\__init__.py", line 512, in plot
        result.save()
      File "\anaconda3\envs\DK_01\lib\site-packages\igraph\drawing\__init__.py", line 309, in save
        self._ctx.show_page()
    igraph.drawing.cairo.MemoryError: out of memory
    

    The file created is corrupted.

    Here is my code:

    import numpy as np
    from ts2vg import NaturalVG
    import igraph as ig
    
    import matplotlib.pyplot as plt
    
    # time domain
    t = np.linspace(1, 40)
    dt = np.diff(t)
    
    # build series
    x1 = np.sin(2*np.pi/10*t)
    x2 = np.sin(2*np.pi/15*t)
    
    y = x1 + x2
    
    plt.plot(t, y, '.-')
    plt.show()
    
    # build HVG
    g = NaturalVG()
    g.build(y)
    
    nx_g = g.as_igraph()
    
    # plotting
    ig.plot(nx_g, target='graph.pdf')
    

    I am using ts2vg 1.0.0, igraph 0.9.11, and pycairo 1.21.0

    opened by ACatAC 1
Releases(v1.0.0)
A high-level plotting API for pandas, dask, xarray, and networkx built on HoloViews

hvPlot A high-level plotting API for the PyData ecosystem built on HoloViews. Build Status Coverage Latest dev release Latest release Docs What is it?

HoloViz 694 Jan 04, 2023
2021 grafana arbitrary file read

2021_grafana_arbitrary_file_read base on pocsuite3 try 40 default plugins of grafana alertlist annolist barchart cloudwatch dashlist elasticsearch gra

ATpiu 5 Nov 09, 2022
Eulera Dashboard is an easy and intuitive way to get a quick feel of what’s happening on the world’s market.

an easy and intuitive way to get a quick feel of what’s happening on the world’s market ! Eulera dashboard is a tool allows you to monitor historical

Salah Eddine LABIAD 4 Nov 25, 2022
Generate a 3D Skyline in STL format and a OpenSCAD file from Gitlab contributions

Your Gitlab's contributions in a 3D Skyline gitlab-skyline is a Python command to generate a skyline figure from Gitlab contributions as Github did at

Félix Gómez 70 Dec 22, 2022
Numerical methods for ordinary differential equations: Euler, Improved Euler, Runge-Kutta.

Numerical methods Numerical methods for ordinary differential equations are methods used to find numerical approximations to the solutions of ordinary

Aleksey Korshuk 5 Apr 29, 2022
📊 Charts with pure python

A zero-dependency python package that prints basic charts to a Jupyter output Charts supported: Bar graphs Scatter plots Histograms 🍑 📊 👏 Examples

Max Humber 54 Oct 04, 2022
Dimensionality reduction in very large datasets using Siamese Networks

ivis Implementation of the ivis algorithm as described in the paper Structure-preserving visualisation of high dimensional single-cell datasets. Ivis

beringresearch 284 Jan 01, 2023
A simple script that displays pixel-based animation on GitHub Activity

GitHub Activity Animator This project contains a simple Javascript snippet that produces an animation on your GitHub activity tracker. The project als

16 Nov 15, 2021
mysql relation charts

sqlcharts 自动生成数据库关联关系图 复制settings.py.example 重命名为settings.py 将数据库配置信息填入settings.DATABASE,目前支持mysql和postgresql 执行 python build.py -b,-b是读取数据库表结构,如果只更新匹

6 Aug 22, 2022
High-level geospatial data visualization library for Python.

geoplot: geospatial data visualization geoplot is a high-level Python geospatial plotting library. It's an extension to cartopy and matplotlib which m

Aleksey Bilogur 1k Jan 01, 2023
Example scripts for generating plots of Bohemian matrices

Bohemian Eigenvalue Plotting Examples This repository contains examples of generating plots of Bohemian eigenvalues. The examples in this repository a

Bohemian Matrices 5 Nov 12, 2022
Visualization Library

CamViz Overview // Installation // Demos // License Overview CamViz is a visualization library developed by the TRI-ML team with the goal of providing

Toyota Research Institute - Machine Learning 67 Nov 24, 2022
Simple and lightweight Spotify Overlay written in Python.

Simple Spotify Overlay This is a simple yet powerful Spotify Overlay. About I have been looking for something like this ever since I got Spotify. I th

27 Sep 03, 2022
a python function to plot a geopandas dataframe

Pretty GeoDataFrame A minimum python function (~60 lines) to draw pretty geodataframe. Based on matplotlib, shapely, descartes. Installation just use

haoming 27 Dec 05, 2022
PyPassword is a simple follow up to PyPassphrase

PyPassword PyPassword is a simple follow up to PyPassphrase. After finishing that project it occured to me that while some may wish to use that option

Scotty 2 Jan 22, 2022
Quickly and accurately render even the largest data.

Turn even the largest data into images, accurately Build Status Coverage Latest dev release Latest release Docs Support What is it? Datashader is a da

HoloViz 2.9k Dec 28, 2022
Python package for hypergraph analysis and visualization.

The HyperNetX library provides classes and methods for the analysis and visualization of complex network data. HyperNetX uses data structures designed to represent set systems containing nested data

Pacific Northwest National Laboratory 304 Dec 27, 2022
Python histogram library - histograms as updateable, fully semantic objects with visualization tools. [P]ython [HYST]ograms.

physt P(i/y)thon h(i/y)stograms. Inspired (and based on) numpy.histogram, but designed for humans(TM) on steroids(TM). The goal is to unify different

Jan Pipek 120 Dec 08, 2022
A simple Monte Carlo simulation using Python and matplotlib library

Monte Carlo python simulation Install linux dependencies sudo apt update sudo apt install build-essential \ software-properties-commo

Samuel Terra 2 Dec 13, 2021
trade bot connected to binance API/ websocket.,, include dashboard in plotly dash to visualize trades and balances

Crypto trade bot 1. What it is Trading bot connected to Binance API. This project made for fun. So ... Do not use to trade live before you have backte

G 3 Oct 07, 2022