Monitor the stability of a pandas or spark dataframe ⚙︎

Overview

Population Shift Monitoring

Build status Package docs status Latest GitHub release GitHub Release Date PyPi downloads

POPMON logo

popmon is a package that allows one to check the stability of a dataset. popmon works with both pandas and spark datasets.

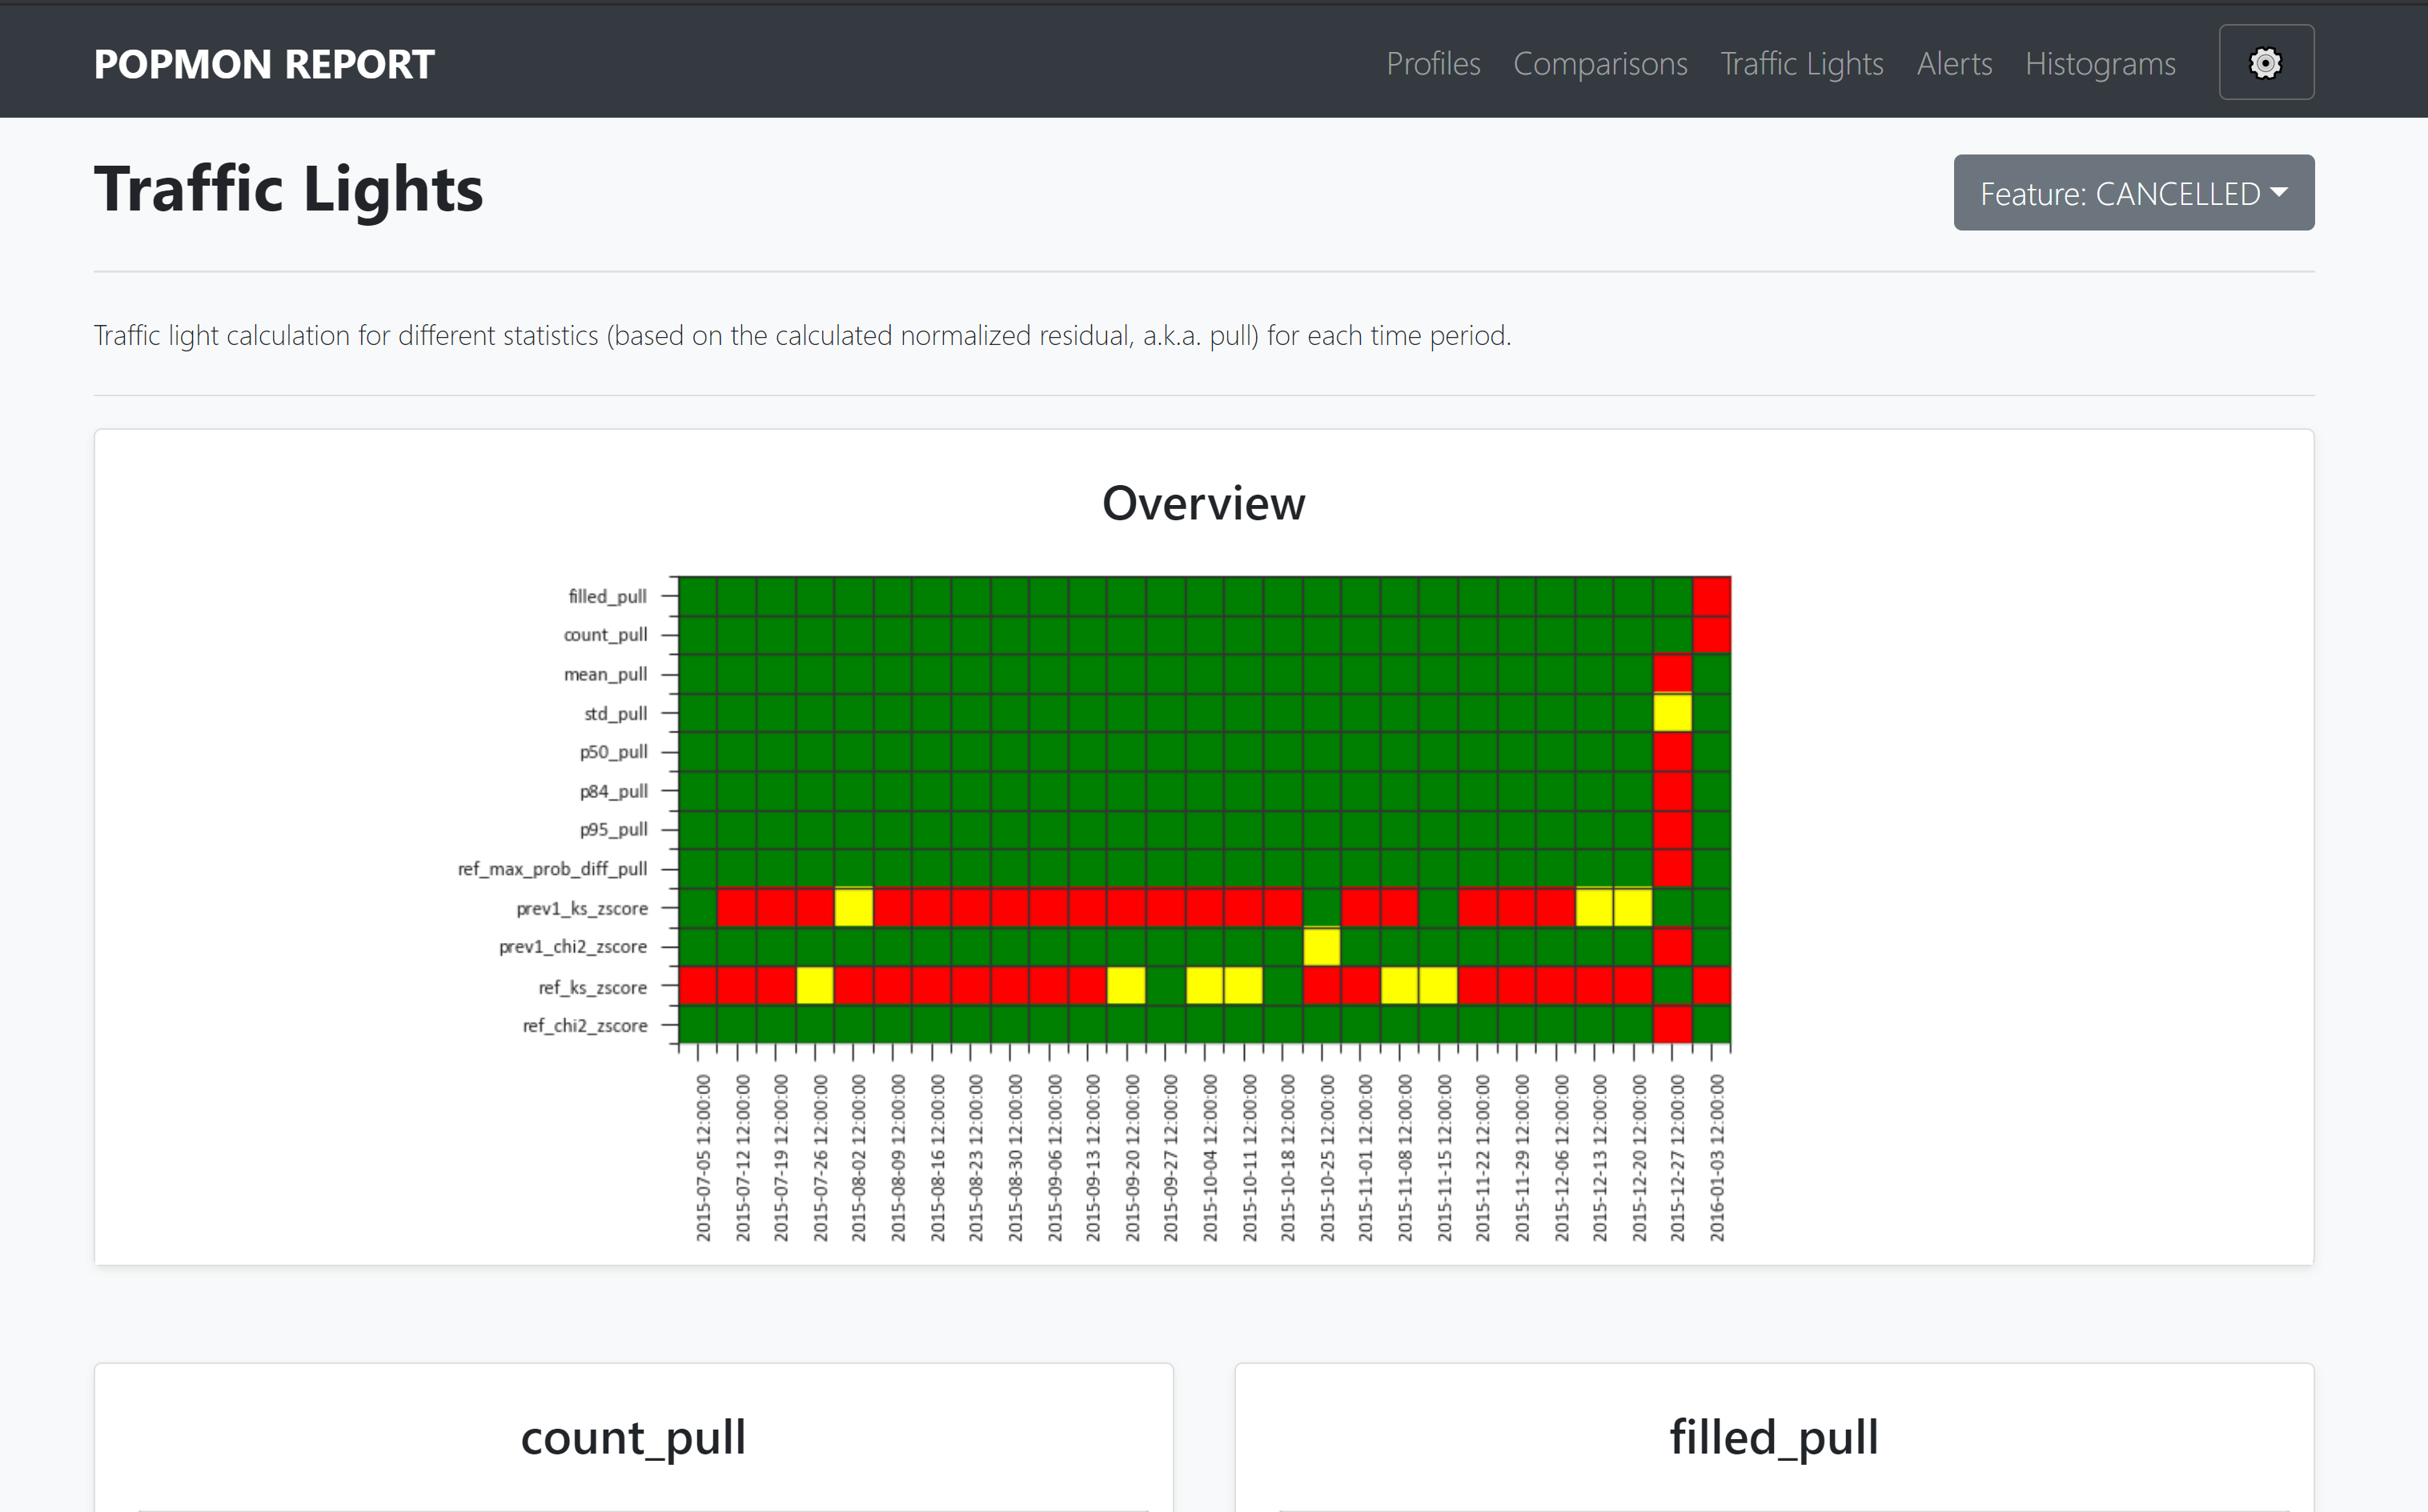
popmon creates histograms of features binned in time-slices, and compares the stability of the profiles and distributions of those histograms using statistical tests, both over time and with respect to a reference. It works with numerical, ordinal, categorical features, and the histograms can be higher-dimensional, e.g. it can also track correlations between any two features. popmon can automatically flag and alert on changes observed over time, such as trends, shifts, peaks, outliers, anomalies, changing correlations, etc, using monitoring business rules.

Traffic Light Overview

Announcements

Spark 3.0

With Spark 3.0, based on Scala 2.12, make sure to pick up the correct histogrammar jar files:

spark = SparkSession.builder.config(
    "spark.jars.packages",
    "io.github.histogrammar:histogrammar_2.12:1.0.20,io.github.histogrammar:histogrammar-sparksql_2.12:1.0.20",
).getOrCreate()

For Spark 2.X compiled against scala 2.11, in the string above simply replace 2.12 with 2.11.

Examples

Documentation

The entire popmon documentation including tutorials can be found at read-the-docs.

Notebooks

Tutorial Colab link
Basic tutorial Open in Colab
Detailed example (featuring configuration, Apache Spark and more) Open in Colab
Incremental datasets (online analysis) Open in Colab
Report interpretation (step-by-step guide) Open in Colab

Check it out

The popmon library requires Python 3.6+ and is pip friendly. To get started, simply do:

$ pip install popmon

or check out the code from our GitHub repository:

$ git clone https://github.com/ing-bank/popmon.git
$ pip install -e popmon

where in this example the code is installed in edit mode (option -e).

You can now use the package in Python with:

import popmon

Congratulations, you are now ready to use the popmon library!

Quick run

As a quick example, you can do:

import pandas as pd
import popmon
from popmon import resources

# open synthetic data
df = pd.read_csv(resources.data("test.csv.gz"), parse_dates=["date"])
df.head()

# generate stability report using automatic binning of all encountered features
# (importing popmon automatically adds this functionality to a dataframe)
report = df.pm_stability_report(time_axis="date", features=["date:age", "date:gender"])

# to show the output of the report in a Jupyter notebook you can simply run:
report

# or save the report to file
report.to_file("monitoring_report.html")

To specify your own binning specifications and features you want to report on, you do:

# time-axis specifications alone; all other features are auto-binned.
report = df.pm_stability_report(
    time_axis="date", time_width="1w", time_offset="2020-1-6"
)

# histogram selections. Here 'date' is the first axis of each histogram.
features = [
    "date:isActive",
    "date:age",
    "date:eyeColor",
    "date:gender",
    "date:latitude",
    "date:longitude",
    "date:isActive:age",
]

# Specify your own binning specifications for individual features or combinations thereof.
# This bin specification uses open-ended ("sparse") histograms; unspecified features get
# auto-binned. The time-axis binning, when specified here, needs to be in nanoseconds.
bin_specs = {
    "longitude": {"bin_width": 5.0, "bin_offset": 0.0},
    "latitude": {"bin_width": 5.0, "bin_offset": 0.0},
    "age": {"bin_width": 10.0, "bin_offset": 0.0},
    "date": {
        "bin_width": pd.Timedelta("4w").value,
        "bin_offset": pd.Timestamp("2015-1-1").value,
    },
}

# generate stability report
report = df.pm_stability_report(features=features, bin_specs=bin_specs, time_axis=True)

These examples also work with spark dataframes. You can see the output of such example notebook code here. For all available examples, please see the tutorials at read-the-docs.

Pipelines for monitoring dataset shift

Advanced users can leverage popmon's modular data pipeline to customize their workflow. Visualization of the pipeline can be useful when debugging, or for didactic purposes. There is a script included with the package that you can use. The plotting is configurable, and depending on the options you will obtain a result that can be used for understanding the data flow, the high-level components and the (re)use of datasets.

Pipeline Visualization

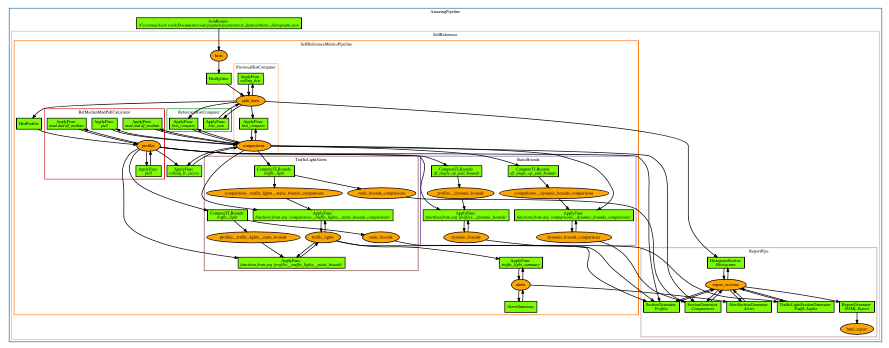
Example pipeline visualization (click to enlarge)

Resources

Presentations

Title Host Date Speaker
Popmon - population monitoring made easy Big Data Technology Warsaw Summit 2021 February 25, 2021 Simon Brugman
Popmon - population monitoring made easy Data Lunch @ Eneco October 29, 2020 Max Baak, Simon Brugman
Popmon - population monitoring made easy Data Science Summit 2020 October 16, 2020 Max Baak
Population Shift Monitoring Made Easy: the popmon package Online Data Science Meetup @ ING WBAA July 8 2020 Tomas Sostak
Popmon: Population Shift Monitoring Made Easy PyData Fest Amsterdam 2020 June 16, 2020 Tomas Sostak
Popmon: Population Shift Monitoring Made Easy Amundsen Community Meetup June 4, 2020 Max Baak

Articles

Title Date Author
Population Shift Analysis: Monitoring Data Quality with Popmon May 21, 2021 Vito Gentile
Popmon Open Source Package — Population Shift Monitoring Made Easy May 20, 2020 Nicole Mpozika

Project contributors

This package was authored by ING Wholesale Banking Advanced Analytics. Special thanks to the following people who have contributed to the development of this package: Ahmet Erdem, Fabian Jansen, Nanne Aben, Mathieu Grimal.

Contact and support

Please note that ING WBAA provides support only on a best-effort basis.

License

Copyright ING WBAA. popmon is completely free, open-source and licensed under the MIT license.

Comments
  • feat: hist_juxtaposition

    feat: hist_juxtaposition

    For now, the last_n is by default set to 2. Therefore, only two dates would appear in the dropdown. For the airline dataset if the last_n is set to max, popmon runs into the issue (for DEPARTURE feature) raised by Tomek https://github.com/ing-bank/popmon/issues/244.

    Screenshot 2022-08-15 at 19 39 24

    closes ing-bank/popmon#230

    enhancement 
    opened by pradyot-09 7
  • Error when stitching histograms

    Error when stitching histograms

    Discussed in https://github.com/ing-bank/popmon/discussions/142

    Originally posted by jeaninejuliettes September 29, 2021 Hello,

    I'm receiving an error when using stitch_histogram and I'm not sure what I'm doing wrong, hope anyone can help me. The error I get is: ValueError: Request to insert delta hists but time_bin_idx not set. Please do.

    The steps I take:

    I start with creating a histogrammar object of the original dataframe

    hists = df.pm_make_histograms() bin_specs = popmon.get_bin_specs(hists)

    later on I receive a new batch of data, which I add to my existing histograms

    new_hists = [new_df.pm_make_histograms(bin_specs=bin_specs)] hists_2= popmon.stitch_histograms(hists_basis=hists, hists_delta=new_hists, time_axis="batch")

    so far so good, but when I try to repeat these steps with yet another new batch of data, I receive the error

    new_hists_2 = [new_df_2.pm_make_histograms(bin_specs=bin_specs)] hists_3 = popmon.stitch_histograms(hists_basis=hists_2, hists_delta=new_hists_2, time_axis="batch")

    Is it not possible to stitch another histogram again? If not, I've found a bit of a cumbersome way to decide on what a good value for my time_bin_idx is. It works so far, but I'm expecting it too fail with other data (or not to work as expected). The way I define the time_bin_idx value is: int(np.ceil(max(hists_2[next(iter(hists_2))].bin_centers()) + 1))

    Hopefully you can point me in the right direction. Thanks!

    opened by mbaak 6
  • Error: cannot import name 'Report' from 'popmon.config'

    Error: cannot import name 'Report' from 'popmon.config'

    Code:

    import popmon from popmon import resources from popmon.config import Report

    Got error: ImportError Traceback (most recent call last) /tmp/ipykernel_707/1841834346.py in 3 import popmon 4 from popmon import resources ----> 5 from popmon.config import Report, Setting

    ImportError: cannot import name 'Report' from 'popmon.config' (/home/user/.local/lib/python3.7/site-packages/popmon/config.py)

    opened by lcheng61 4
  • Error with pydantic when using some custom settings in the report generation

    Error with pydantic when using some custom settings in the report generation

    With version 1.0.0, when using custom settings in df.pm_stability_report() like show_stats, I get an error stating such option is not allowed:

    ValidationError: 2 validation errors for Settings

    I couldn't reproduce it when using popmon==0.9.0.

    opened by gus-morales 3
  • DataProfiler - A Scalable Data Profiling Library

    DataProfiler - A Scalable Data Profiling Library

    Howdy!

    I'm reaching out as a maintainer of the DataProfiler library.

    I think it might be useful to your project so I'm reaching out! Would love to collaborate and see how we can help popmon.

    We effectively wrote a library to improve upon the objectives of pandas-profiling with some neat added functionality:

    • Auto-Detect & Load: CSV, AVRO, Parquet, JSON, Text, URL data = Data("your_filepath_or_url.csv")
    • Profile data: calculating statistics and doing entity detection (for PII) profile = Profiler(data)
    • Merge profiles: profile3 = profile1 + profile2; enabling distributed profile generation
    • Compare profiles: profile_diff = profile1.diff(profile2)
    • Generate reports: readable_report = profile.report(report_options={"output_format": "compact"})
    import json
    from dataprofiler import Data, Profiler
    
    data = Data("your_file.csv") # Auto-Detect & Load: CSV, AVRO, Parquet, JSON, Text, URL
    
    print(data.data.head(5)) # Access data directly via a compatible Pandas DataFrame
    
    profile = Profiler(data) # Calculate Statistics, Entity Recognition, etc
    
    readable_report = profile.report(report_options={"output_format": "compact"})
    
    print(json.dumps(readable_report, indent=4))
    
    opened by lettergram 3
  • Library doesn't run in Spark 3.0+: Replace the dependency of histogrammar with native Spark functionality

    Library doesn't run in Spark 3.0+: Replace the dependency of histogrammar with native Spark functionality

    Currently, the dependency with the library, which hasn't been further developed since 2016, creates a dependency with Scala 2.11 which limits the execution in Spark 3.0 (which was only built on Scala 2.12). I think I could replace the functionality with Bucketizer functionality in native spark.

    opened by kedemdor 3
  • Imports Optimized

    Imports Optimized

    isort helps you to sort your import list. It simply optimized the script and increases the readability.

    There is no big change in the concept. Algorithms are still working as well.

    I'm contributing for Hacktoberfest. I will appreciate it if you add the "Hacktoberfest" label to this PR. :) Thanks.

    opened by lnxpy 3
  • missing tutorial datasets

    missing tutorial datasets

    Hi, awesome tool!

    Advanced tutorial datasets are not in test_data dir, but still in notebooks dir, as far as I can see. Hence the advanced tutorial notebooks don't run out of the box, at least for me. I don't have permissions to push to a develop branch.

    Changes to be committed: (use "git reset HEAD ..." to unstage)

    renamed:    popmon/notebooks/flight_delays.csv.gz -> popmon/test_data/flight_delays.csv.gz
    renamed:    popmon/notebooks/flight_delays_reference.csv.gz -> popmon/test_data/flight_delays_reference.csv.gz
    

    Cheers - Alex

    opened by AlexKoutsman 3
  • build(deps): update docutils requirement from <0.17 to <0.20

    build(deps): update docutils requirement from <0.17 to <0.20

    Updates the requirements on docutils to permit the latest version.

    Dependabot will resolve any conflicts with this PR as long as you don't alter it yourself. You can also trigger a rebase manually by commenting @dependabot rebase.


    Dependabot commands and options

    You can trigger Dependabot actions by commenting on this PR:

    • @dependabot rebase will rebase this PR
    • @dependabot recreate will recreate this PR, overwriting any edits that have been made to it
    • @dependabot merge will merge this PR after your CI passes on it
    • @dependabot squash and merge will squash and merge this PR after your CI passes on it
    • @dependabot cancel merge will cancel a previously requested merge and block automerging
    • @dependabot reopen will reopen this PR if it is closed
    • @dependabot close will close this PR and stop Dependabot recreating it. You can achieve the same result by closing it manually
    • @dependabot ignore this major version will close this PR and stop Dependabot creating any more for this major version (unless you reopen the PR or upgrade to it yourself)
    • @dependabot ignore this minor version will close this PR and stop Dependabot creating any more for this minor version (unless you reopen the PR or upgrade to it yourself)
    • @dependabot ignore this dependency will close this PR and stop Dependabot creating any more for this dependency (unless you reopen the PR or upgrade to it yourself)
    dependencies 
    opened by dependabot[bot] 2
  • Feat/plotly express

    Feat/plotly express

    • The histograms, heatmaps and comparisons have been replaced with interactive Plotly graphs. Plotly.js is used to build the graphs on the go from json.
    • Initial tests show that plotly reports are smaller in size compared to matplotlib and the takes way less time for report generation compared to matplotlib.
    • use parameter 'online_report' to use plotly.js from cdn server and use report online. Else, plotly.js is embedded in the report and can be used offline too.

    newplot

    newplot (3)

    newplot (2)

    closes ing-bank/popmon#164

    enhancement reporting 
    opened by pradyot-09 2
  • Feature/heatmap time series plotting

    Feature/heatmap time series plotting

    Added heatmap feature to visualize features over time for EDA.

    image

    Screenshot 2022-05-09 at 15 03 53

    User can set Heatmap color map by giving the 'cmap' argument pm_stability report(). User can set top_n argument to deal with high cardinality. User can disable specific heatmap by giving heatmap name in the disable_heatmap[] argument in the pm_stability_report().

    closes ing-bank/popmon#185 closes ing-bank/popmon#199

    opened by pradyot-09 2
  • Rolling reference comparisons

    Rolling reference comparisons

    A wide variety of references is provided by popmon out-of-the-box. A reference may be static (a fixed training set, or the current dataset itself for exploratory data analysis) or dynamic (sliding or growing as more data becomes available). The reference is compared against batches, and they can be sequential (batched) or sliding (rolling).

    Popmon should enable all combinations, and currently lacks external reference + rolling comparison.

    | | Reference | Compare to | Implemented | |---|---|---|---| | Self-reference | Static | Self (batched) | ✓ | | External reference | Static | Batched | ✓ | | Rolling reference | Rolling | Rolling/sliding | ✓ | | Expanding reference | Expanding | Rolling/sliding | ✓ | | External reference | Static | Rolling/sliding | ✗ |

    Thanks to @LorenaPoenaru!

    enhancement 
    opened by sbrugman 0
  • code coverage of 100%

    code coverage of 100%

    The risk of breaking functionality on introducing new features could be reduced by ensuring that each line of code is covered by the tests and that this is enforced at test time. Other repos, such as this also use this.

    For that, we can include pytest-cov to the test dependencies and increase the test coverage until it passes (see this annswer).

    good first issue help wanted CI internal improvement 
    opened by sbrugman 0
  • Traffic light boundaries for count variables

    Traffic light boundaries for count variables

    The traffic light bounds provided by the pull/Z-score calculation are symmetrical. For count variables this can lead to bounds outside the constraints (below zero).

    enhancement statistics 
    opened by sbrugman 0
  • Reject unsupported column types

    Reject unsupported column types

    Running popmon on a DataFrame with columns containing mutable sequences, tuples or sets generates cryptic errors. popmon should return an error message.

    enhancement good first issue API 
    opened by sbrugman 0
Releases(v1.4.0)
Owner
ING Bank
ING Open-source projects
ING Bank
INFO-H515 - Big Data Scalable Analytics

INFO-H515 - Big Data Scalable Analytics Jacopo De Stefani, Giovanni Buroni, Théo Verhelst and Gianluca Bontempi - Machine Learning Group Exercise clas

Yann-Aël Le Borgne 58 Dec 11, 2022
Datashredder is a simple data corruption engine written in python. You can corrupt anything text, images and video.

Datashredder is a simple data corruption engine written in python. You can corrupt anything text, images and video. You can chose the cha

2 Jul 22, 2022
Python Library for learning (Structure and Parameter) and inference (Statistical and Causal) in Bayesian Networks.

pgmpy pgmpy is a python library for working with Probabilistic Graphical Models. Documentation and list of algorithms supported is at our official sit

pgmpy 2.2k Dec 25, 2022
Cold Brew: Distilling Graph Node Representations with Incomplete or Missing Neighborhoods

Cold Brew: Distilling Graph Node Representations with Incomplete or Missing Neighborhoods Introduction Graph Neural Networks (GNNs) have demonstrated

37 Dec 15, 2022
Fitting thermodynamic models with pycalphad

ESPEI ESPEI, or Extensible Self-optimizing Phase Equilibria Infrastructure, is a tool for thermodynamic database development within the CALPHAD method

Phases Research Lab 42 Sep 12, 2022
PySpark bindings for H3, a hierarchical hexagonal geospatial indexing system

h3-pyspark: Uber's H3 Hexagonal Hierarchical Geospatial Indexing System in PySpark PySpark bindings for the H3 core library. For available functions,

Kevin Schaich 12 Dec 24, 2022
Powerful, efficient particle trajectory analysis in scientific Python.

freud Overview The freud Python library provides a simple, flexible, powerful set of tools for analyzing trajectories obtained from molecular dynamics

Glotzer Group 195 Dec 20, 2022
Repository created with LinkedIn profile analysis project done

EN/en Repository created with LinkedIn profile analysis project done. The datase

Mayara Canaver 4 Aug 06, 2022
Data processing with Pandas.

Processing-data-with-python This is a simple example showing how to use Pandas to create a dataframe and the processing data with python. The jupyter

1 Jan 23, 2022
Data collection, enhancement, and metrics calculation.

l3_data_collection Data collection, enhancement, and metrics calculation. Summary Repository containing code for QuantDAO's JDT data collection task.

Ruiwyn 3 Dec 23, 2022
A Python and R autograding solution

Otter-Grader Otter Grader is a light-weight, modular open-source autograder developed by the Data Science Education Program at UC Berkeley. It is desi

Infrastructure Team 93 Jan 03, 2023
Detecting Underwater Objects (DUO)

Underwater object detection for robot picking has attracted a lot of interest. However, it is still an unsolved problem due to several challenges. We take steps towards making it more realistic by ad

27 Dec 12, 2022
BIGDATA SIMULATION ONE PIECE WORLD CENSUS

ONE PIECE is a Japanese manga of great international success. The story turns inhabited in a fictional world, tells the adventures of a young man whose body gained rubber properties after accidentall

Maycon Cypriano 3 Jun 30, 2022
An Integrated Experimental Platform for time series data anomaly detection.

Curve Sorry to tell contributors and users. We decided to archive the project temporarily due to the employee work plan of collaborators. There are no

Baidu 486 Dec 21, 2022
Instant search for and access to many datasets in Pyspark.

SparkDataset Provides instant access to many datasets right from Pyspark (in Spark DataFrame structure). Drop a star if you like the project. 😃 Motiv

Souvik Pratiher 31 Dec 16, 2022
This creates a ohlc timeseries from downloaded CSV files from NSE India website and makes a SQLite database for your research.

NSE-timeseries-form-CSV-file-creator-and-SQL-appender- This creates a ohlc timeseries from downloaded CSV files from National Stock Exchange India (NS

PILLAI, Amal 1 Oct 02, 2022
WAL enables programmable waveform analysis.

This repro introcudes the Waveform Analysis Language (WAL). The initial paper on WAL will appear at ASPDAC'22 and can be downloaded here: https://www.

Institute for Complex Systems (ICS), Johannes Kepler University Linz 40 Dec 13, 2022
InDels analysis of CRISPR lines by NGS amplicon sequencing technology for a multicopy gene family.

CRISPRanalysis InDels analysis of CRISPR lines by NGS amplicon sequencing technology for a multicopy gene family. In this work, we present a workflow

2 Jan 31, 2022
Statistical & Probabilistic Analysis of Store Sales, University Survey, & Manufacturing data

Statistical_Modelling Statistical & Probabilistic Analysis of Store Sales, University Survey, & Manufacturing data Statistical Methods for Decision Ma

Avnika Mehta 1 Jan 27, 2022
VevestaX is an open source Python package for ML Engineers and Data Scientists.

VevestaX Track failed and successful experiments as well as features. VevestaX is an open source Python package for ML Engineers and Data Scientists.

Vevesta 24 Dec 14, 2022