Full ELT process on GCP environment.

Overview

Rent Houses Germany - GCP Pipeline

gcp_pipeline

Project:

  • The goal of the project is to extract data about house rentals in Germany, store, process and analyze it using GCP tools. The focus here is to practice and get used to the GCP environment.

Main Tools:

Python

Cloud Storage

BigQuery

Dataprep

Data Studio

Looker

Crontab

Bash

Data Extraction and Storage:

Source: https://www.immonet.de/

  • The data extraction is done in 3 steps where first the quantity of offers for each city is collected, them the ID's for each offers and finaly the raw information about each rent offer is extracted.

  • The first script is responsible to scrape the number of offers in each city and save the information as a CSV file in Cloud Storage. The second script gets the previous CSV file from Cloud Storage and uses it to scrape all ID's from each offers in each city and load the information back to Cloud Storage as a new CSV file. The third script gets the rent offer's ID info from Cloud Storage and perform a web-scraper to collect all information for each ID and save it back to Cloud Storage, again as a CSV file containing all raw infos about the offers.

  • All the extractions steps are scheduled though a Crontab Job to run everyday at 0h.

cronjob

Data Preprocessing.

  • As the last CSV file contains all the RAW information about each offer grouped in only two columns, a preprocessing step is needed. The preprocessor script gets the CSV file with the raw information from Cloud Storage, separates the data into the appropriate columns already performing some cleaning like excluding not needed characters. Again, the preprocessed CSV file is stored in Cloud Storage.

all_offers_infos_raw.csv:

raw_infos

all_offers_infos_pp.csv:

raw_infos

Data Cleaning and Preparation.

  • Here is used Cloud Dataprep to clean and prepare the data for further use. To transform the rent data into useble information first we need to clean and prepare it. Dataprep is a realy good tool where we can look inside the data and can perform all kind of filtering, removing and preparations. Dataprep gets the preprocessed csv file from Cloud Storage and runs a "recipe" tranforming the data to be analyzed. Dataprep saves the cleaned and final csv file both into Data Storage (a backup) and into a BigQuery warehouse.

dataprepJob

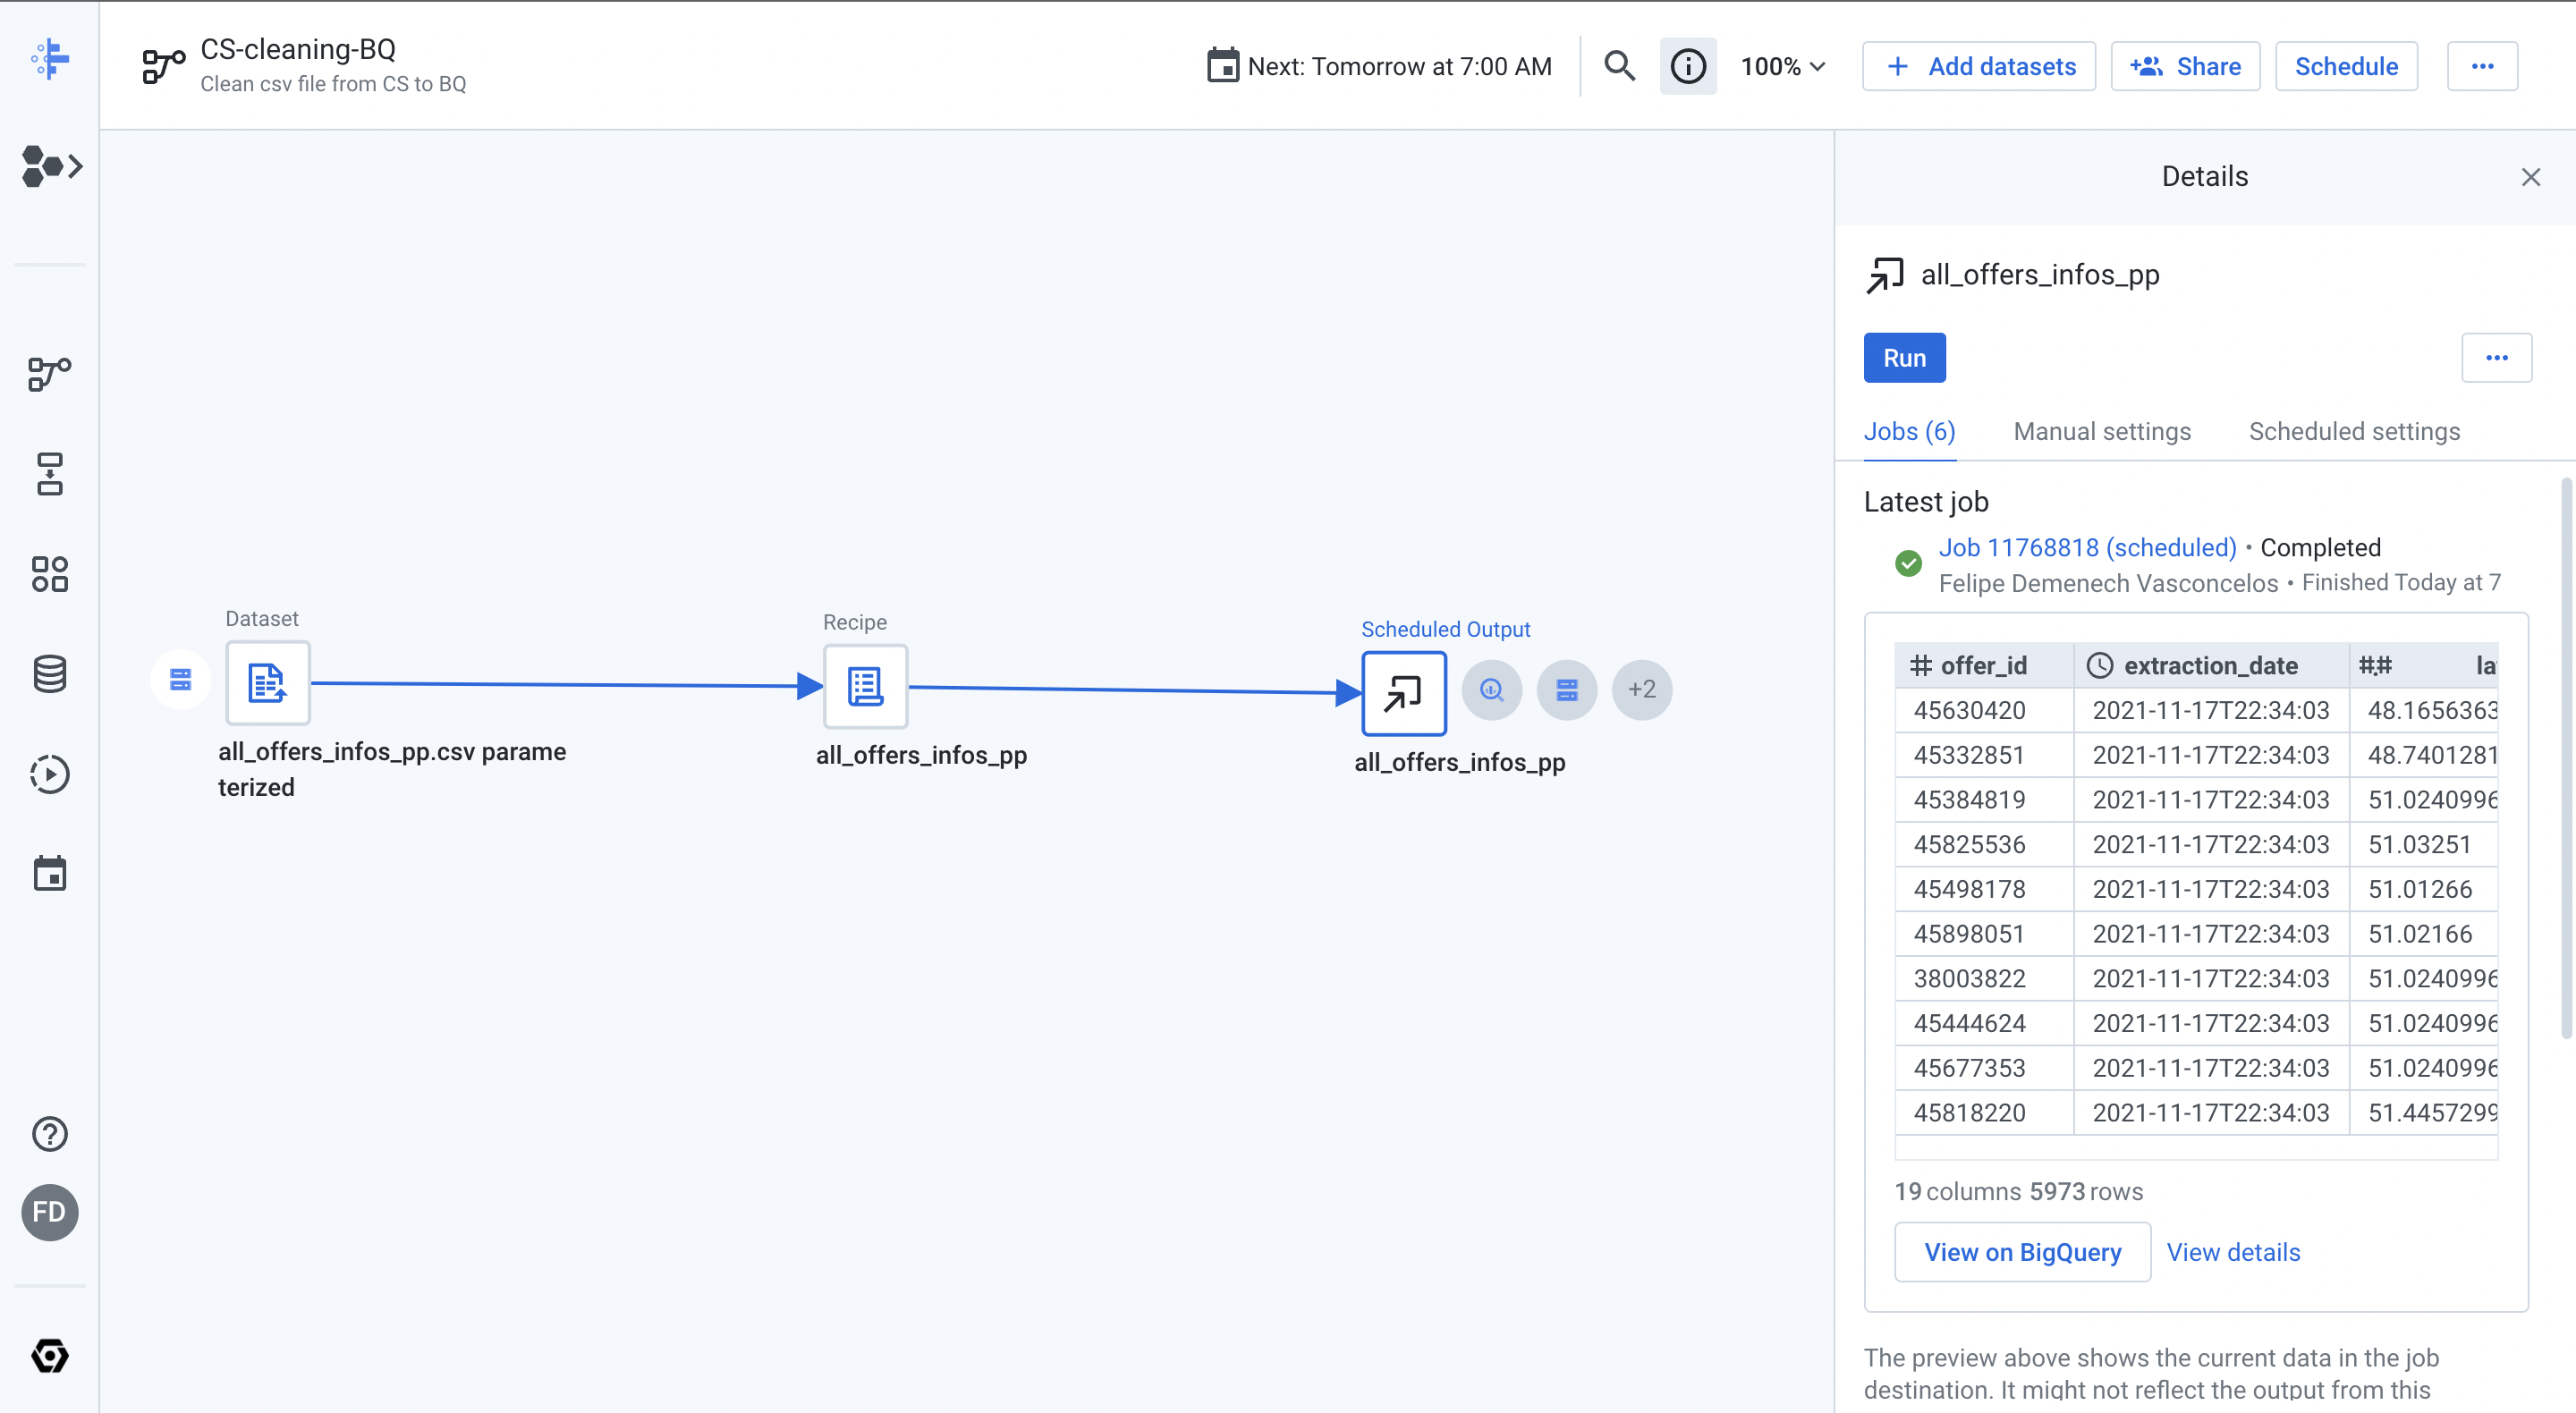
  • The Dataproc job was scheduled to run everyday 7 A.M and update the data source for the reports.

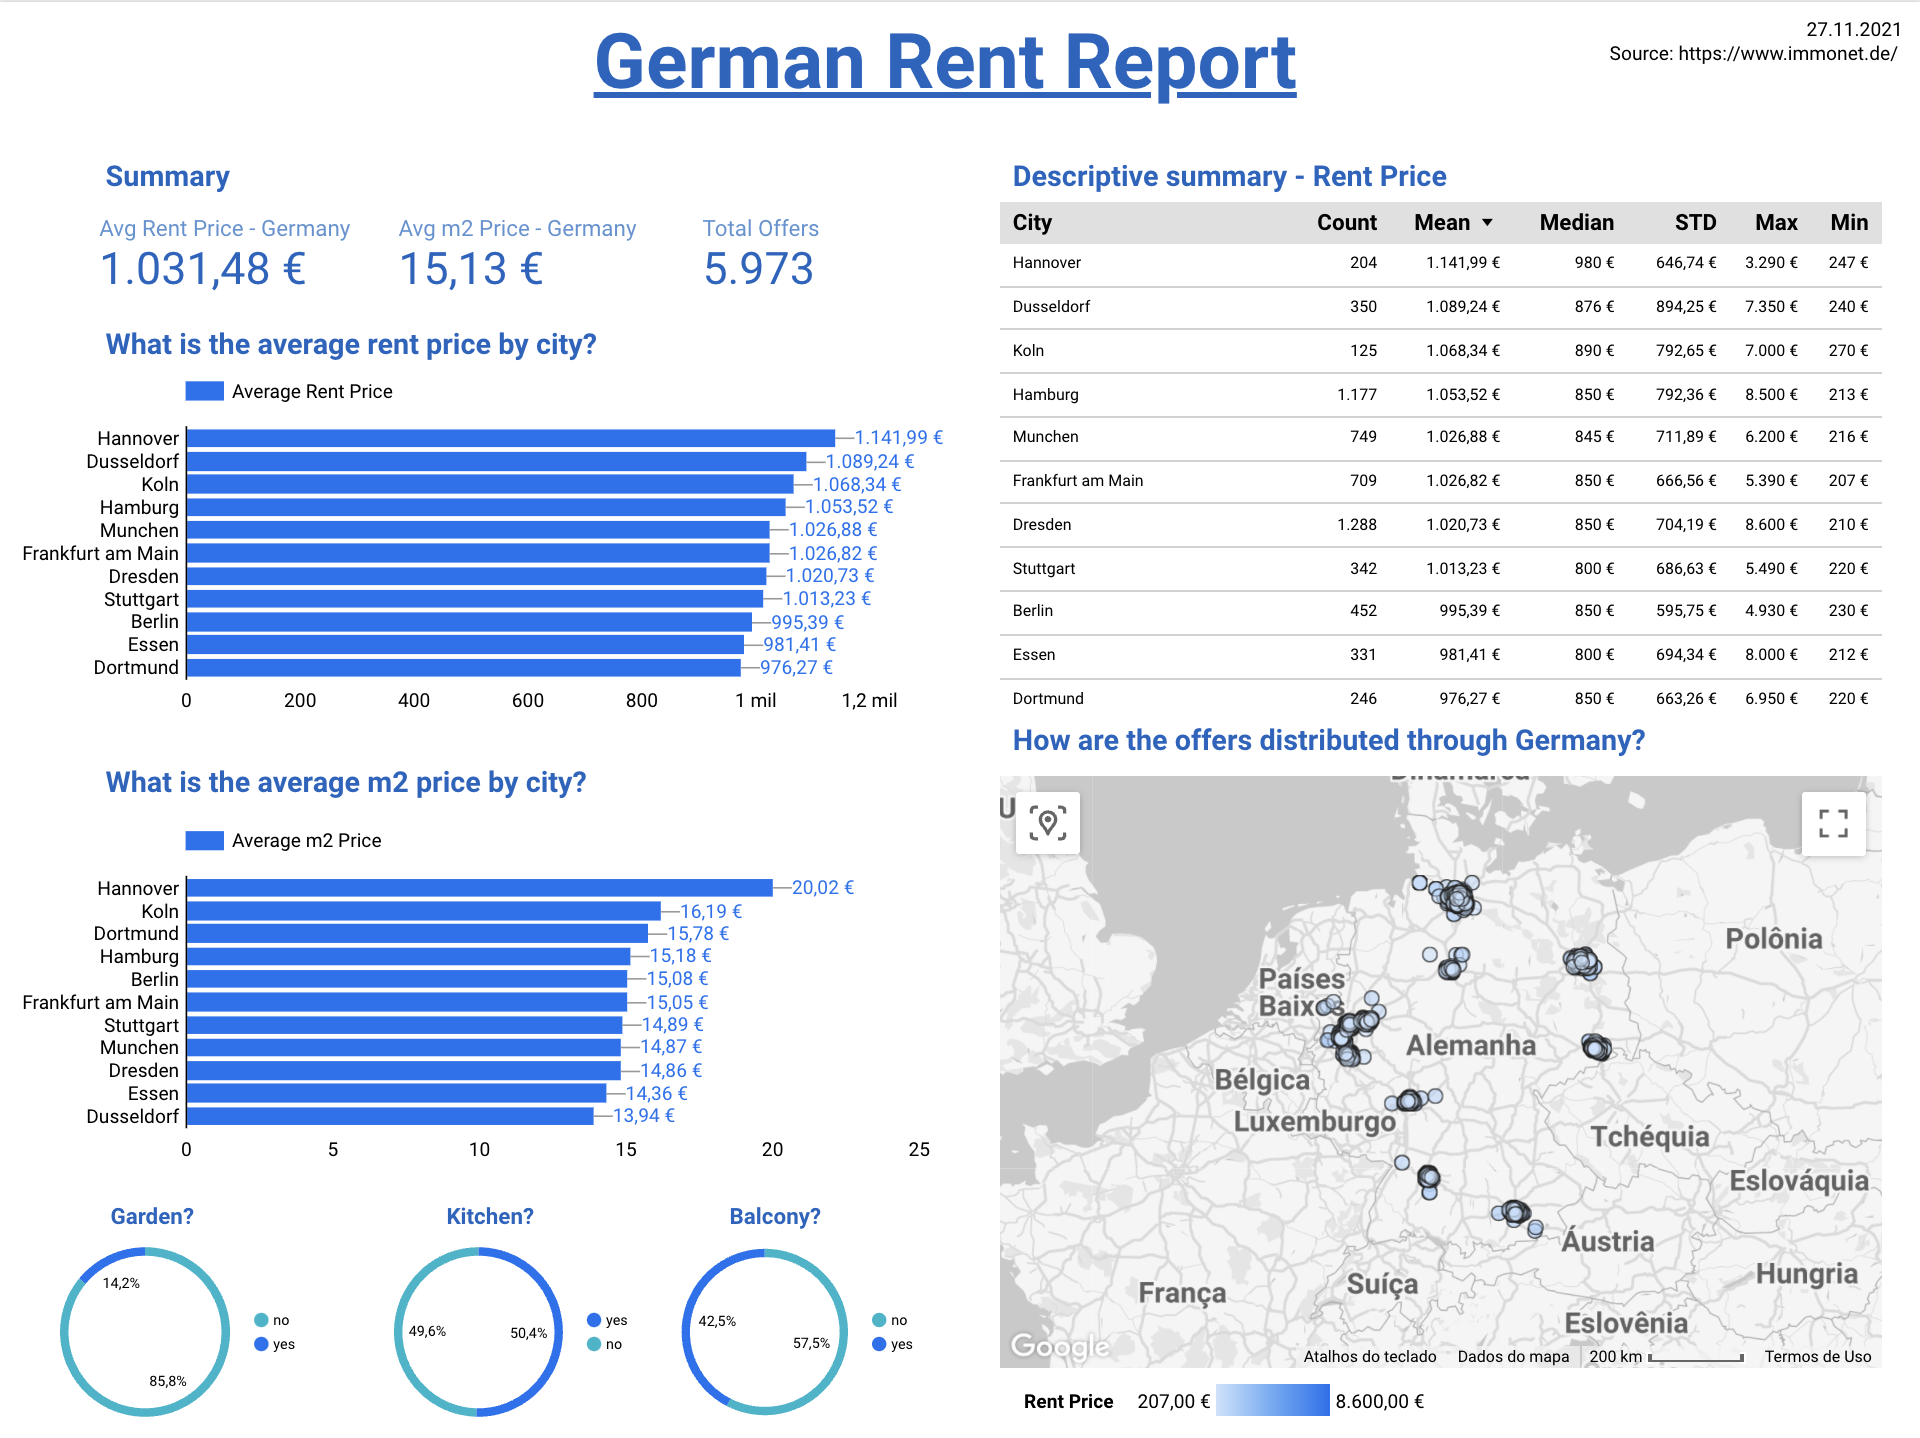
Data Analysis - Data Studio Report.

  • With the data cleaned and loaded into BigQuery it's time to display the information. The GCP tools used to display the data was Data Studio and Looker. First I used Data Studio to make a simple report summaring all the rent houses main informantion and schedule to send an e-mail with the updated report avery day at 8 A.M.

    data_studio_dashboard

German Rent Report - 27.11.21

Data Analysis - Looker Dashboard.

  • I'm still working on it.

Conclusion.

  • The tools available on Google Cloud Platform are simply amazing. As in all Cloud platforms, the tools are available and are arranged in a way to make the user's life easier, it is really cool and very practical to build an entire ETL/ELT process using the available tools and it makes everything much easier and agile. The fact that you don't have to deal with hardware fiscally, the automated scalability, the advanced security controls, the availability of virtually all the necessary tools in one place, the integration between the tools, and all the other characteristics of cloud environments contribute greatly to the considerable increase in productivity, in environments like these we only need to focus on doing the main part of our job, on delivering the result, and that is amazing. For me it has been a very pleasant experience to work and experience these features, the next steps now are to continue learning and applying them and in the future to seek certifications.
Owner
Felipe Demenech Vasconcelos
In a constant learning path...
Felipe Demenech Vasconcelos
Spaghetti: an open-source Python library for the analysis of network-based spatial data

pysal/spaghetti SPAtial GrapHs: nETworks, Topology, & Inference Spaghetti is an open-source Python library for the analysis of network-based spatial d

Python Spatial Analysis Library 203 Jan 03, 2023
Python implementation of Principal Component Analysis

Principal Component Analysis Principal Component Analysis (PCA) is a dimension-reduction algorithm. The idea is to use the singular value decompositio

Ignacio Darago 1 Nov 06, 2021
A Numba-based two-point correlation function calculator using a grid decomposition

A Numba-based two-point correlation function (2PCF) calculator using a grid decomposition. Like Corrfunc, but written in Numba, with simplicity and hackability in mind.

Lehman Garrison 3 Aug 24, 2022
First and foremost, we want dbt documentation to retain a DRY principle. Every time we repeat ourselves, we waste our time. Second, we want to understand column level lineage and automate impact analysis.

dbt-osmosis First and foremost, we want dbt documentation to retain a DRY principle. Every time we repeat ourselves, we waste our time. Second, we wan

Alexander Butler 150 Jan 06, 2023
This repository contains some analysis of possible nerdle answers

Nerdle Analysis https://nerdlegame.com/ This repository contains some analysis of possible nerdle answers. Here's a quick overview: nerdle.py contains

0 Dec 16, 2022
pandas: powerful Python data analysis toolkit

pandas is a Python package that provides fast, flexible, and expressive data structures designed to make working with "relational" or "labeled" data both easy and intuitive.

pandas 36.4k Jan 03, 2023
Very basic but functional Kakuro solver written in Python.

kakuro.py Very basic but functional Kakuro solver written in Python. It uses a reduction to exact set cover and Ali Assaf's elegant implementation of

Louis Abraham 4 Jan 15, 2022
A Python adaption of Augur to prioritize cell types in perturbation analysis.

A Python adaption of Augur to prioritize cell types in perturbation analysis.

Theis Lab 2 Mar 29, 2022
Streamz helps you build pipelines to manage continuous streams of data

Streamz helps you build pipelines to manage continuous streams of data. It is simple to use in simple cases, but also supports complex pipelines that involve branching, joining, flow control, feedbac

Python Streamz 1.1k Dec 28, 2022
Weather analysis with Python, SQLite, SQLAlchemy, and Flask

Surf's Up Weather analysis with Python, SQLite, SQLAlchemy, and Flask Overview The purpose of this analysis was to examine weather trends (precipitati

Art Tucker 1 Sep 05, 2021
Generate lookml for views from dbt models

dbt2looker Use dbt2looker to generate Looker view files automatically from dbt models. Features Column descriptions synced to looker Dimension for eac

lightdash 126 Dec 28, 2022
Cleaning and analysing aggregated UK political polling data.

Analysing aggregated UK polling data The tweet collection & storage pipeline used in email-service is used to also collect tweets from @britainelects.

Ajay Pethani 0 Dec 22, 2021
Data Analysis for First Year Laboratory at Imperial College, London.

Data Analysis for First Year Laboratory at Imperial College, London. For personal reference only, and to reference in lab reports and lab books.

Martin He 0 Aug 29, 2022
Hatchet is a Python-based library that allows Pandas dataframes to be indexed by structured tree and graph data.

Hatchet Hatchet is a Python-based library that allows Pandas dataframes to be indexed by structured tree and graph data. It is intended for analyzing

Lawrence Livermore National Laboratory 14 Aug 19, 2022
A CLI tool to reduce the friction between data scientists by reducing git conflicts removing notebook metadata and gracefully resolving git conflicts.

databooks is a package for reducing the friction data scientists while using Jupyter notebooks, by reducing the number of git conflicts between different notebooks and assisting in the resolution of

dataroots 86 Dec 25, 2022
University Challenge 2021 With Python

University Challenge 2021 This repository contains: The TeX file of the technical write-up describing the University / HYPER Challenge 2021 under late

2 Nov 27, 2021
yt is an open-source, permissively-licensed Python library for analyzing and visualizing volumetric data.

The yt Project yt is an open-source, permissively-licensed Python library for analyzing and visualizing volumetric data. yt supports structured, varia

The yt project 367 Dec 25, 2022
The OHSDI OMOP Common Data Model allows for the systematic analysis of healthcare observational databases.

The OHSDI OMOP Common Data Model allows for the systematic analysis of healthcare observational databases.

Bell Eapen 14 Jan 02, 2023
Create HTML profiling reports from pandas DataFrame objects

Pandas Profiling Documentation | Slack | Stack Overflow Generates profile reports from a pandas DataFrame. The pandas df.describe() function is great

10k Jan 01, 2023
fds is a tool for Data Scientists made by DAGsHub to version control data and code at once.

Fast Data Science, AKA fds, is a CLI for Data Scientists to version control data and code at once, by conveniently wrapping git and dvc

DAGsHub 359 Dec 22, 2022