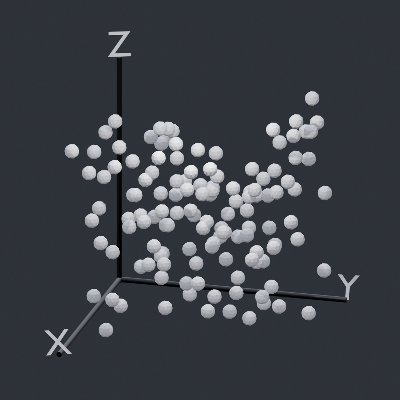
Data-FX is an addon for Blender (2.9) that allows for the visualization of data with different charts

Overview

Data-FX

Data-FX is an addon for Blender (2.9) that allows for the visualization of data with different charts

Currently, there are only 2 chart options...

  • A Scatter plot which plots up to 3 values in 3d space
  • And a "Map plot" that visualizes points on a sphere when given longitudes and latitudes

Below are some examples

How To

Data-FX is located in the View3D sidebar (N -> DataFX)

Simply select the headers from your csv file, edit your settings, and hit generate!

Notable Features

  • Custom duplicate objects (Scatter Plot)
  • Auto axis markers (Scatter Plot)
  • Auto populating .csv header selection (Scatter Plot, Map Plot)
  • Support of Geographic coordinate data (Map Plot)

Planned Features

  • More chart types
  • More supported data types
  • Various chart loading optimizations
  • Global chart menu
You might also like...
Streamlit dashboard examples - Twitter cashtags, StockTwits, WSB, Charts, SQL Pattern Scanner

streamlit-dashboards Streamlit dashboard examples - Twitter cashtags, StockTwits, WSB, Charts, SQL Pattern Scanner Tutorial Video https://ww

mysql relation charts

sqlcharts 自动生成数据库关联关系图 复制settings.py.example 重命名为settings.py 将数据库配置信息填入settings.DATABASE,目前支持mysql和postgresql 执行 python build.py -b,-b是读取数据库表结构,如果只更新匹

Altair extension for saving charts in a variety of formats.

Altair Saver This packge provides extensions to Altair for saving charts to a variety of output types. Supported output formats are: .json/.vl.json: V

🐞 📊 Ladybug extension to generate 2D charts

ladybug-charts Ladybug extension to generate 2D charts. Installation pip install ladybug-charts QuickStart import ladybug_charts API Documentation Loc

GitHub English Top Charts

Help you discover excellent English projects and get rid of the interference of other spoken language.

Simple addon for snapping active object to mesh ground

Snap to Ground Simple addon for snapping active object to mesh ground How to install: install the Python file as an addon use shortcut "D" in 3D view

Apache Superset is a Data Visualization and Data Exploration Platform

Superset A modern, enterprise-ready business intelligence web application. Why Superset? | Supported Databases | Installation and Configuration | Rele

Apache Superset is a Data Visualization and Data Exploration Platform

Apache Superset is a Data Visualization and Data Exploration Platform

Automatic data visualization in atom with the nteract data-explorer

Data Explorer Interactively explore your data directly in atom with hydrogen! The nteract data-explorer provides automatic data visualization, so you

Comments
  • Map Values in Scatter Plot

    Map Values in Scatter Plot

    Currently all values are read from the file and directly translated into their respective positions. Instead of this being hard-coded, the user should be able to choose the size of the graph they want and have the values be mapped to that range.

    enhancement 
    opened by LandonFerg 2
  • Allow Headers in CSV to be Viewed in Plugin

    Allow Headers in CSV to be Viewed in Plugin

    Right now Data-FX only uses numerics to represent the headers you want to select for your x, y and z values for generating a scatter plot. These should be represented instead by their header names to be more human readable.

    opened by LandonFerg 1
Owner
Landon Ferguson
Hello World
Landon Ferguson
A concise grammar of interactive graphics, built on Vega.

Vega-Lite Vega-Lite provides a higher-level grammar for visual analysis that generates complete Vega specifications. You can find more details, docume

Vega 4k Jan 08, 2023
ecoglib: visualization and statistics for high density microecog signals

ecoglib: visualization and statistics for high density microecog signals This library contains high-level analysis tools for "topos" and "chronos" asp

1 Nov 17, 2021
Yata is a fast, simple and easy Data Visulaization tool, running on python dash

Yata is a fast, simple and easy Data Visulaization tool, running on python dash. The main goal of Yata is to provide a easy way for persons with little programming knowledge to visualize their data e

Cybercreek 3 Jun 28, 2021
A tool for creating SVG timelines from simple JSON input.

A tool for creating SVG timelines from simple JSON input.

Jason Reisman 432 Dec 30, 2022
A simple project on Data Visualization for CSCI-40 course.

Simple-Data-Visualization A simple project on Data Visualization for CSCI-40 course - the instructions can be found here SAT results in New York in 20

Hugo Matousek 8 Oct 27, 2021
Python code for solving 3D structural problems using the finite element method

3DFEM Python 3D finite element code This python code allows for solving 3D structural problems using the finite element method. New features will be a

Rémi Capillon 6 Sep 29, 2022
D-Analyst : High Performance Visualization Tool

D-Analyst : High Performance Visualization Tool D-Analyst is a high performance data visualization built with python and based on OpenGL. It allows to

4 Apr 14, 2022
Streamlit-template - A streamlit app template based on streamlit-option-menu

streamlit-template A streamlit app template for geospatial applications based on

Qiusheng Wu 41 Dec 10, 2022
Regress.me is an easy to use data visualization tool powered by Dash/Plotly.

Regress.me Regress.me is an easy to use data visualization tool powered by Dash/Plotly. Regress.me.-.Google.Chrome.2022-05-10.15-58-59.mp4 Get Started

Amar 14 Aug 14, 2022
Graphical visualizer for spectralyze by Lauchmelder23

spectralyze visualizer Graphical visualizer for spectralyze by Lauchmelder23 Install Install matplotlib and ffmpeg. Put ffmpeg.exe in same folder as v

Matthew 1 Dec 21, 2021
Data visualization using matplotlib

Data visualization using matplotlib project instructions Top 5 Most Common Coffee Origins In this visualization I used data from Ankur Chavda on Kaggl

13 Oct 27, 2021
This component provides a wrapper to display SHAP plots in Streamlit.

streamlit-shap This component provides a wrapper to display SHAP plots in Streamlit.

Snehan Kekre 30 Dec 10, 2022
Smarthome Dashboard with Grafana & InfluxDB

Smarthome Dashboard with Grafana & InfluxDB This is a complete overhaul of my Raspberry Dashboard done with Flask. I switched from sqlite to InfluxDB

6 Oct 20, 2022
A program that analyzes data from inertia measurement units installed in aircraft and generates g-exceedance curves.

A program that analyzes data from inertia measurement units installed in aircraft and generates g-exceedance curves.

Pooya 1 Dec 02, 2021
Visualization of hidden layer activations of small multilayer perceptrons (MLPs)

MLP Hidden Layer Activation Visualization To gain some intuition about the internal representation of simple multi-layer perceptrons (MLPs) I trained

Andreas Köpf 7 Dec 30, 2022
A Python library for plotting hockey rinks with Matplotlib.

Hockey Rink A Python library for plotting hockey rinks with Matplotlib. Installation pip install hockey_rink Current Rinks The following shows the cus

24 Jan 02, 2023
Plotting data from the landroid and a raspberry pi zero to a influx-db

landroid-pi-influx Plotting data from the landroid and a raspberry pi zero to a influx-db Dependancies Hardware: Landroid WR130E Raspberry Pi Zero Wif

2 Oct 22, 2021
Draw datasets from within Jupyter.

drawdata This small python app allows you to draw a dataset in a jupyter notebook. This should be very useful when teaching machine learning algorithm

vincent d warmerdam 505 Nov 27, 2022
Create SVG drawings from vector geodata files (SHP, geojson, etc).

SVGIS Create SVG drawings from vector geodata files (SHP, geojson, etc). SVGIS is great for: creating small multiples, combining lots of datasets in a

Neil Freeman 78 Dec 09, 2022
matplotlib: plotting with Python

Matplotlib is a comprehensive library for creating static, animated, and interactive visualizations in Python. Check out our home page for more inform

Matplotlib Developers 16.7k Jan 08, 2023