Project: Netflix Data Analysis and Visualization with Python

Overview

Project: Netflix Data Analysis and Visualization with Python

MyNetflixDashboard

Table of Contents

  1. General Info
  2. Installation
  3. Demo
  4. Usage and Main Functionalities
  5. Contributing

General Info

This is a compact Data Visualization project I worked on for fun and to deepen my knowledge about visualizations and graphs using python libraries.

From conception and design to every line of code, the entire Dashboard was worked on by myself. During this project, I was able to repeat and deepen what I had previously learned in my Data Science course of study. Especially, I was able to familiarize myself with pandas and work on my data visualization skills, which I greatly enjoied!

The dataset I used for the Netflix data analytics task consists of my personal Netflix data, which I requested through their website. You can get access to your own data through this link. Feel free to download it and use my code to look into your own viewing behaviour :)

Installation

Requirements: Make sure you have Python 3.7+ installed on your computer. You can download the latest version of Python here.

Req. Packages:

  • pandas
  • dash
  • dash_bootstrap_components
  • ploty.express
  • plotly.graph_objects

Demo

Demo_MyNetflixDashboard_komprimiert.mov

Usage and Main Functionalities

Want to know more about your own Netflix behaviour? For test usage you can download your own Netflix data. Just follow this link and Netflix will send you your personal data.

Please also refer to the comments within the code itself to get more information on the functionalities of the program.


0. Preparing the data for analysis

  • This part cleans up the original data and prepares it for analysis.
  • In the process, columns that are not needed are dropped.
  • Time data is converted into appropriate time formats and split into several columns. The days of the week are added.
  • In addition, the titles of the movies/series are split (title, season number, episode name).

1. Analysis

  • This part of the code is about analyzing the data.
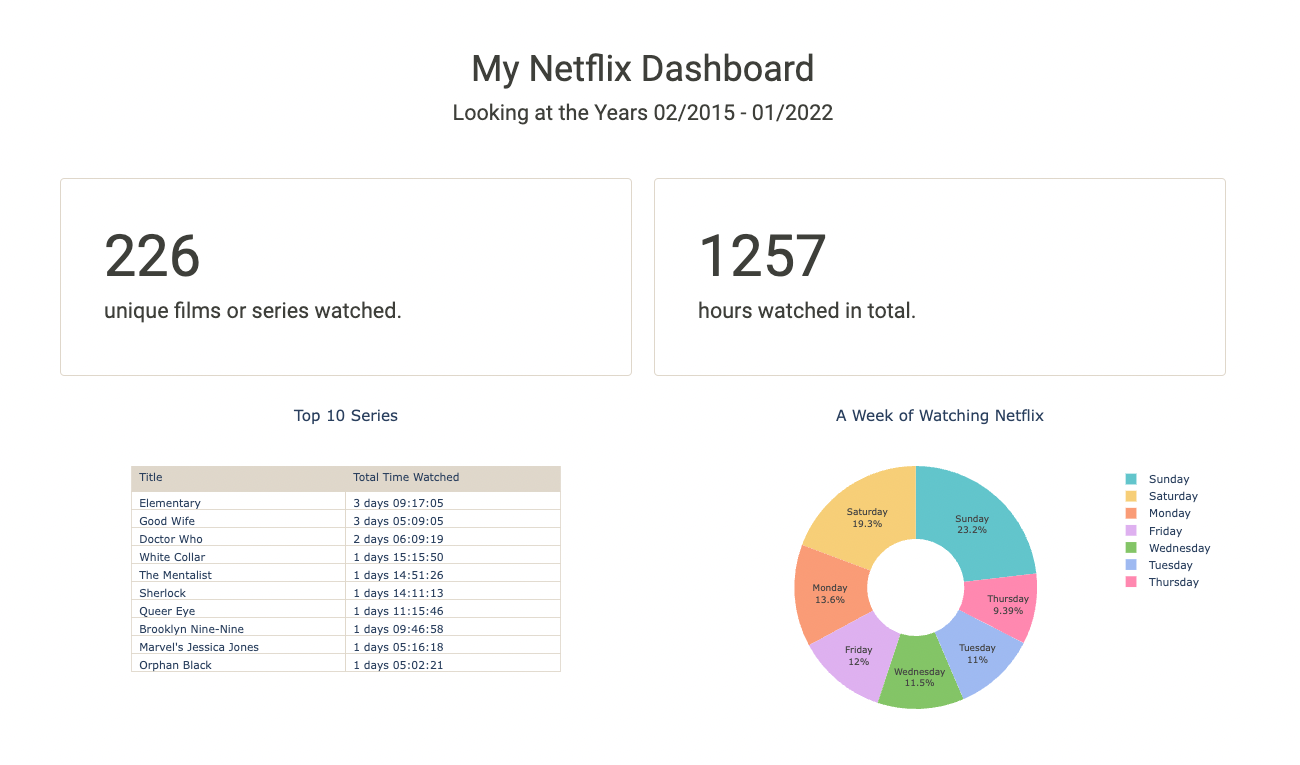
  • We find out how many movies or series were watched over the entire period. We also count the total number of hours Netflix was watched.
  • A pie chart is created that shows which days of the week are watched.
  • In addition, the top 10 series that were watched the longest (in terms of total duration) are displayed.
  • A line chart shows Netflix viewing behavior over the years, counting the total number of hours Netflix was watched.

NetflixOverTime

2. Dash App Layout

  • plotly's Dash is now used to create an Interactive Dashboard of Netflix data.
  • The individual graphics and texts are arranged in rows and containers.
  • This part also includes a dropdown menu that the user can interact with.

3. App Callback

  • Here we connect an interactive bar chart to the Dash Components.
  • The chart represents our total annual hours of Netflix watched, grouped by month. The chart is filterable by year.

MonthlyViews

Contributing

Your comments, suggestions, and contributions are welcome. Please feel free to contribute pull requests or create issues for bugs and feature requests.
Owner
Kathrin Hälbich
Data Science Student and PR- & Marketing-Expert
Kathrin Hälbich
A Streamlit web-app for a data-science project that aims to evaluate if the answer to a question is helpful.

How useful is the aswer? A Streamlit web-app for a data-science project that aims to evaluate if the answer to a question is helpful. If you want to l

1 Dec 17, 2021
Transform-Invariant Non-Negative Matrix Factorization

Transform-Invariant Non-Negative Matrix Factorization A comprehensive Python package for Non-Negative Matrix Factorization (NMF) with a focus on learn

EMD Group 6 Jul 01, 2022
InDels analysis of CRISPR lines by NGS amplicon sequencing technology for a multicopy gene family.

CRISPRanalysis InDels analysis of CRISPR lines by NGS amplicon sequencing technology for a multicopy gene family. In this work, we present a workflow

2 Jan 31, 2022
Feature Detection Based Template Matching

Feature Detection Based Template Matching The classification of the photos was made using the OpenCv template Matching method. Installation Use the pa

Muhammet Erem 2 Nov 18, 2021
A Python package for Bayesian forecasting with object-oriented design and probabilistic models under the hood.

Disclaimer This project is stable and being incubated for long-term support. It may contain new experimental code, for which APIs are subject to chang

Uber Open Source 1.6k Dec 29, 2022
Synthetic Data Generation for tabular, relational and time series data.

An Open Source Project from the Data to AI Lab, at MIT Website: https://sdv.dev Documentation: https://sdv.dev/SDV User Guides Developer Guides Github

The Synthetic Data Vault Project 1.2k Jan 07, 2023
2019 Data Science Bowl

Kaggle-2019-Data-Science-Bowl-Solution - Here i present my solution to kaggle 2019 data science bowl and how i improved it to win a silver medal in that competition.

Deepak Nandwani 1 Jan 01, 2022
Get mutations in cluster by querying from LAPIS API

Cluster Mutation Script Get mutations appearing within user-defined clusters. Usage Clusters are defined in the clusters dict in main.py: clusters = {

neherlab 1 Oct 22, 2021
PyPSA: Python for Power System Analysis

1 Python for Power System Analysis Contents 1 Python for Power System Analysis 1.1 About 1.2 Documentation 1.3 Functionality 1.4 Example scripts as Ju

758 Dec 30, 2022
X-news - Pipeline data use scrapy, kafka, spark streaming, spark ML and elasticsearch, Kibana

X-news - Pipeline data use scrapy, kafka, spark streaming, spark ML and elasticsearch, Kibana

Nguyễn Quang Huy 5 Sep 28, 2022
A Python package for the mathematical modeling of infectious diseases via compartmental models

A Python package for the mathematical modeling of infectious diseases via compartmental models. Originally designed for epidemiologists, epispot can be adapted for almost any type of modeling scenari

epispot 12 Dec 28, 2022
Single-Cell Analysis in Python. Scales to >1M cells.

Scanpy – Single-Cell Analysis in Python Scanpy is a scalable toolkit for analyzing single-cell gene expression data built jointly with anndata. It inc

Theis Lab 1.4k Jan 05, 2023
Numerical Analysis toolkit centred around PDEs, for demonstration and understanding purposes not production

Numerics Numerical Analysis toolkit centred around PDEs, for demonstration and understanding purposes not production Use procedure: Initialise a new i

George Whittle 1 Nov 13, 2021
A Python and R autograding solution

Otter-Grader Otter Grader is a light-weight, modular open-source autograder developed by the Data Science Education Program at UC Berkeley. It is desi

Infrastructure Team 93 Jan 03, 2023
Data Intelligence Applications - Online Product Advertising and Pricing with Context Generation

Data Intelligence Applications - Online Product Advertising and Pricing with Context Generation Overview Consider the scenario in which advertisement

Manuel Bressan 2 Nov 18, 2021
Python ELT Studio, an application for building ELT (and ETL) data flows.

The Python Extract, Load, Transform Studio is an application for performing ELT (and ETL) tasks. Under the hood the application consists of a two parts.

Schlerp 55 Nov 18, 2022
This tool parses log data and allows to define analysis pipelines for anomaly detection.

logdata-anomaly-miner This tool parses log data and allows to define analysis pipelines for anomaly detection. It was designed to run the analysis wit

AECID 32 Nov 27, 2022
PostQF is a user-friendly Postfix queue data filter which operates on data produced by postqueue -j.

PostQF Copyright © 2022 Ralph Seichter PostQF is a user-friendly Postfix queue data filter which operates on data produced by postqueue -j. See the ma

Ralph Seichter 11 Nov 24, 2022
Meltano: ELT for the DataOps era. Meltano is open source, self-hosted, CLI-first, debuggable, and extensible.

Meltano is open source, self-hosted, CLI-first, debuggable, and extensible. Pipelines are code, ready to be version c

Meltano 625 Jan 02, 2023
Vaex library for Big Data Analytics of an Airline dataset

Vaex-Big-Data-Analytics-for-Airline-data A Python notebook (ipynb) created in Jupyter Notebook, which utilizes the Vaex library for Big Data Analytics

Nikolas Petrou 1 Feb 13, 2022