GDSHelpers is an open-source package for automatized pattern generation for nano-structuring.

Overview

GDSHelpers

Build Status Documentation Status GitHub release PyPI DOI

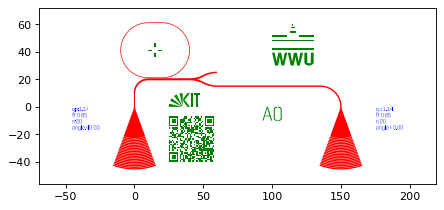
GDSHelpers in an open-source package for automatized pattern generation for nano-structuring. It allows exporting the pattern in the GDSII-format and OASIS-format, which are currently mainly used for describing 2D-masks. Currently, the focus is mainly on photonic and superconducting circuitry. The library consists of growing list of parts, which can be composed into larger circuits.

So far, the following parts are implemented:

  • A waveguide part, allowing easy chaining of bends and straight waveguides.
    • Includes parameterized paths and Bézier curves.
    • Automatic smooth connection to a target point/port
    • The size of the waveguide can be tapered (linear or by a user defined function), which can e.g. be used for optical edge coupling or electronic contact pads
    • Allows to design slot-waveguides and coplanar waveguides (with arbitrary number of rails)
  • Different types of splitters:
    • Y-splitter
    • MMI-splitters
    • Directional splitter
  • Couplers
    • Grating couplers (allowing apodized gratings)
    • Tapers for hybrid 3D-integration
  • Ring and racetrack resonators
  • Mach-Zehnder interferometers
  • Strip to slot mode converter
  • Spirals
  • Superconducting nanowire single photon detectors (SNSPDs)
  • Superconducting nanoscale Transistors (NTRONs)
  • Different types of markers
  • QRcodes
  • A possibility to include images
  • Text-elements for labeling the structures
  • GDSII-import

Besides this it also allows to perform conveniently operations on the design, like:

  • Convert the pattern for usage of positive resist
  • Create holes around the circuitry, which is e.g. necessary for under-etching
  • Shapely-operations can also be applied on the generated structures, e.g. shrinking or inflating of the geometry
  • Surrounding the structures with holes in a rectangular lattice and filling waveguides with holes in a honeycomb lattice for controlling vortex dynamics

The structures are organized in cells, which allow:

  • Adding structures on multiple layers
  • Adding cells into other cells, the cells can be added with an offset with respect to the parent cell and can be rotated
  • Storing additional information, which can be used for saving design parameters
  • Automatized generation of region layers
  • Parallelized export

Additionally the structures can conveniently be simulated by:

  • Using the meep integration (FDTD)

Finally, there are also different formats in which the pattern can be exported:

  • The GDSII-format, which is quite often used for (electron beam/...)-lithography
  • The OASIS-format, which one of the successors of the GDSII-format
  • To an 2D-image
  • To stl-objects which are useful e.g. for 3D-renderings
  • Directly to a blender-file or an rendered 3D-image

Citing GDSHelpers

We would appreciate if you cite the following paper in your publications for which you used GDSHelpers:

Helge Gehring, Matthias Blaicher, Wladick Hartmann, and Wolfram H. P. Pernice, "Python based open source design framework for integrated nanophotonic and superconducting circuitry with 2D-3D-hybrid integration" OSA Continuum 2, 3091-3101 (2019)

Documentation

You can find the documentation on readthedocs. If you have problems using GDSHelpers don't hesitate to contact us using Discussions or send me a mail.

Installation

The GDSHelpers can be installed via pip using (more details in the installation documentation)

pip install gdshelpers
Comments
  • Rounding & Spacing Issue when writing Cell Array to gdsii

    Rounding & Spacing Issue when writing Cell Array to gdsii

    https://github.com/HelgeGehring/gdshelpers/blob/96cfe541c18360dc8a8902fa723b7b5edfabbe72/gdshelpers/export/gdsii_export.py#L82-L84

    So I am trying to implement 2 cells within a cell as an array. I am using the standard micron as the unit, but I am trying to have increased precision to 0.1nm [10000 grid steps per micron]. When I make the spacing equal micron steps apart, it works. When they are not, there is a spacing issue. I am pretty sure the problem is here in the code referenced above as internally the spacing kept in the gdspy_cell->references->spacing is correct. The code shown seems to round before the points are scaled by the grid_steps_per_unit rather than after, which I think is causing my problem.

    opened by Trajectory989 4
  • Add Waveguide.add_route_straight_to_port

    Add Waveguide.add_route_straight_to_port

    Add method add_route_straight_to_port to Waveguide. Allows routing a straight segment to a target port and tapers the width linearly on the way.

    This can be used for electrode contact pads etc.

    route_port

    enhancement 
    opened by fbeutel 4
  • issue about Boolean operation: difference

    issue about Boolean operation: difference

    Thanks for gdshelpers, this package is amazing!

    When I used the boolean operation difference(), I got a small problem as shown in the figure, and it may occurr at the junction of the arc and the spiral. If I changed the parameter num, this issue would disapear. I don't know how to fix it. I tried to get the same layout by boolean operation not from gdspy package, and it looked correct.

    result_difference

    The code is attached below.

    from gdshelpers.geometry.chip import Cell
    from gdshelpers.parts.spiral import Spiral
    from gdshelpers.geometry import geometric_union
    
    # create the spiral
    spiral = Spiral(origin=(0,0), angle=0, width=0.45, num=16, gap=3, inner_gap=30)
    
    # get the shapely 
    device = geometric_union([spiral])
    # Boolean operation: difference
    buffer_device = device.buffer(3)
    buffer_not_device = buffer_device.difference(device)
    
    cell = Cell('cell_difference')
    cell.add_to_layer(1, buffer_not_device)
    # Here don't use cell.show() to verify the issue, and use cell.save() please.
    cell.save('gdshelpers_difference.gds')
    
    
    # And I found it's OK if I use "not" from gdspy.boolean()
    from gdshelpers.geometry import convert_to_layout_objs
    import gdspy
    # STEP 1: 
    lib = gdspy.GdsLibrary(precision = 1e-10)
    
    # create a new cell to save 
    cell_gdspy = lib.new_cell("cell_not_gdspy")
    
    geo1 = convert_to_layout_objs(buffer_device,library='gdspy')
    geo2 = convert_to_layout_objs(device,library='gdspy')
    inv = gdspy.boolean(geo1, geo2, "not")
    
    cell_gdspy.add(inv)
    lib.write_gds("gdspy_not.gds")
    bug 
    opened by HoneyGump 4
  • Waveguide.add_parameterized_path fails with multiple widths

    Waveguide.add_parameterized_path fails with multiple widths

    This seems to be a regression, because I think it worked before, but the following produces an error:

    wg = Waveguide([0, 0], 0, [1, 2, 1])
    wg.add_parameterized_path(lambda t: [10*t, 10*t])
    wg.get_shapely_object()
    

    Error:

    Traceback (most recent call last):
      File "gdshelpers/tests/test_waveguide.py", line 40, in test_waveguide_multiple_widths
        wg.add_parameterized_path(some_path)
      File "gdshelpers/parts/waveguide.py", line 275, in add_parameterized_path
        poly_path_1 = sample_coordinates + start[..., None] * sample_coordinates_d1_normed_ortho
    ValueError: operands could not be broadcast together with shapes (3,1) (28,2) 
    

    I opened a pull request which adds a failing test case: #26

    bug 
    opened by fbeutel 2
  • First example Script error

    First example Script error

    Hi @HelgeGehring,

    The first example script is flawed:

    1. numpy is missing
    2. Something is wrong with gdshelpers.parts.logo:
    ~/.local/lib/python3.7/site-packages/gdshelpers/parts/logo.py in get_shapely_object(self)
        180             # WWU width = 368.93 = 369     *M2 == w
        181             # box width unscaled = w = 336
    --> 182             m2 = w / 369.  # scale width of WWU to width of logo
        183             m = self.height / (h + 10 + 114)  # scaling factor height
        184 
    

    the code works with numpy and without logo:

    import numpy as np
    from gdshelpers.geometry.chip import Cell
    from gdshelpers.parts.waveguide import Waveguide
    from gdshelpers.parts.coupler import GratingCoupler
    from gdshelpers.parts.resonator import RingResonator
    from gdshelpers.parts.splitter import Splitter
    #from gdshelpers.parts.logo import KITLogo, WWULogo
    from gdshelpers.parts.optical_codes import QRCode
    from gdshelpers.parts.text import Text
    from gdshelpers.parts.marker import CrossMarker
    
    # Generate a coupler with parameters from the coupler database
    coupler1 = GratingCoupler.make_traditional_coupler_from_database([0, 0], 1, 'sn330', 1550)
    coupler2 = GratingCoupler.make_traditional_coupler_from_database([150, 0], 1, 'sn330', 1550)
    
    coupler1_desc = coupler1.get_description_text(side='left')
    coupler2_desc = coupler2.get_description_text(side='right')
    
    # And add a simple waveguide to it
    wg1 = Waveguide.make_at_port(coupler1.port)
    wg1.add_straight_segment(10)
    wg1.add_bend(-np.pi/2, 10, final_width=1.5)
    
    res = RingResonator.make_at_port(wg1.current_port, gap=0.1, radius=20,
                                     race_length=10, res_wg_width=0.5)
    
    wg2 = Waveguide.make_at_port(res.port)
    wg2.add_straight_segment(30)
    splitter = Splitter.make_at_root_port(wg2.current_port, total_length=20, sep=10, wg_width_branches=1.0)
    
    wg3 = Waveguide.make_at_port(splitter.right_branch_port)
    wg3.add_route_single_circle_to_port(coupler2.port)
    
    # Add a marker just for fun
    marker = CrossMarker.make_traditional_paddle_markers(res.center_coordinates)
    
    # The fancy stuff
    #kit_logo = KITLogo([25, 0], 10)
    #wwu_logo = WWULogo([100, 30], 30, 2)
    qr_code = QRCode([25, -40], 'https://www.uni-muenster.de/Physik.PI/Pernice', 1.0)
    dev_label = Text([100, 0], 10, 'A0', alignment='center-top')
    
    # Create a Cell to hold the objects
    cell = Cell('EXAMPLE')
    
    # Convert parts to gdsCAD polygons
    cell.add_to_layer(1, coupler1, wg1, res, wg2, splitter, wg3, coupler2)
    #cell.add_to_layer(2, wwu_logo, kit_logo, qr_code, dev_label)
    cell.add_to_layer(2, marker)
    cell.add_to_layer(3, coupler1_desc, coupler2_desc)
    cell.show()
    

    best, quearitis

    opened by quaeritis 2
  • Allow to set the last derivative point in add_parameterized_path

    Allow to set the last derivative point in add_parameterized_path

    Since add_parameterized_path has no information about how the waveguide will proceed afterwards, it can be useful to set the last point in the list of derivatives.

    opened by fbeutel 2
  • convert_to_positive_resist: Allow clearance features and exclusion features

    convert_to_positive_resist: Allow clearance features and exclusion features

    Allows specifying clearance_features: useful when building e.g. DLW tapers with positive resist image

    When reusing cells (e.g. grating couplers on one cell) which have interfaces to other features the interface must not be covered with the positive resist but must remain open. This allows to specify exclusion zones at these interfaces. image

    opened by fbeutel 1
  • Update waveguide.py

    Update waveguide.py

    changed line 283 from "...lower radii..." to "...larger radii..."

    If the outer lines of a parameterized wg intersect, a larger radius or smaller wg must be used.

    opened by jr2701 1
  • Allow to limit the max number of workers when exporting in parallel

    Allow to limit the max number of workers when exporting in parallel

    I ran into some out-of-memory errors when too many big cells where involved, limiting the number of workers can help (and might also help if you want to keep using your computer while exporting :) )

    opened by fbeutel 1
  • Create Contributing guide

    Create Contributing guide

    It would be helpful to have a small CONTRIBUTING.md in the root directory with the main instructions and conventions.

    Especially the Flake8 flavor used, so people don't have to look it up in the CI script

    flake8 gdshelpers/ --max-line-length=120

    opened by fbeutel 1
  • Fix waveguide route straight

    Fix waveguide route straight

    All route to port functions expect the target port to be pointing towards the current_port of the waveguide to be routed. This fixes add_route_straight_to_port to be consistent and adds a testcase.

    bug 
    opened by fbeutel 1
  • GDSIIImport's get_as_shapely does not work properly with cell arrays

    GDSIIImport's get_as_shapely does not work properly with cell arrays

    If this is run on a cell array, it does not recognize multiple instantiations....only the original copy at the original origin is placed (like just cellarray[0] and not the others....). See the zip.zip file. Use the Top Cell for copy image zip.zip

    opened by Trajectory989 2
  • Allow cell reuse when creating cells in parallel

    Allow cell reuse when creating cells in parallel

    Sometime, the cell creation is expensive and benefits from parallelization. At the same time, some sub-cells can be reused between cells.

    Currently, this fails because when ProcessPoolExecutor (or similar parallelization structures) are used, sub-cells are pickled and deserialized again. When merging the parallel cells together in the end, comparison for those sub-cells fails because they have no common identity anymore.

    This adds a UUID when a cell is created, such that cells can be identified by their UUID.

    Possible downside is that if a user modifies a sub-cell after it has been pickled, the changes might get lost, but this can easily be avoided by finishing the sub-cell before using it.

    opened by fbeutel 0
  • Desc format

    Desc format

    Suggestion for a new format for the desc output dictionary. This follows more closely the idea of GDSII that each cell is identified by a unique name and can be referenced mulitple times.

    With this new format, the resulting dict will only contain the desc data for each cell once and just store (name) references to the other cells.

    Basically, the resulting dict will look somewhat like this:

    {
        "root": "name_of_root_cell",
        "cells": {
            "name_of_root_cell": {
                "desc": {...},
                "cells": [ <list of all cells referenced by this cell (with origin, angle etc.)>  ]
            },
            "other_cell": {
                "desc": {...},
                "cells": [ <list of all cells referenced by this cell (with origin, angle etc.)>  ]
            },
        }
    }
    
    opened by fbeutel 0
  • Added new spiral part where length can be set

    Added new spiral part where length can be set

    This replaces the old spiral with a new version of an archimedean spiral which allows to set the length. The number of turns required to achieve the length is determined numerically (afaik an analytical solution doesn't exist).

    Different types are supported. Especially for use inside an MZI the inline and inline_rel types are of interest. spiral

    ToDo's before merge:

    • [ ] Update changelog
    • [x] Add to tests
    • [x] Update documentation
    • [x] Allow choosing the spiral direction (752d3b2)
    • [x] Choose an appropriate guess value for the numerical estimation
    enhancement 
    opened by fbeutel 5
Releases(v1.2.1)
  • v1.2.1(Jan 26, 2022)

    • Allow explicit definition of datatype by passing a tuple (layer, datatype) as layer
    • Allow setting the width of LineStrings
    • Angle of sub-cells considered in DLW-data and boundaries
    • Fix GDSII-export: allow negative angles, correct rounding of spacing
    • Allow specifying clearance features and exlusion features for convert_to_positive_resist
    Source code(tar.gz)
    Source code(zip)
  • v1.2.0(May 29, 2021)

  • v1.1.4(Jan 31, 2021)

    • Waveguide: added add_left_bend and add_right_bend to make code easier readable
    • added alphanumeric_to_id as an inverse of id_to_alphanumeric
    • allow to limit the numbers of workers for parallel export
    • fixed oasis export
    Source code(tar.gz)
    Source code(zip)
  • v1.1.3(Nov 24, 2020)

    • Grating coupler: make_traditional_coupler now allows to apodize the period of the grating
    • Port: added with_width function to generate a copy of the Port with a certain width
    • Increased precision in add_straight_segment by evaluating derivative
    • Added add_route_straight_to_port to Waveguide
    • Fixed evaluation of width-parameter in add_parametrized_path
    • Stopped testing with Python 3.5, as it reached it's end-of-life and added a warning
    • Deprecated gdsCAD, as it isn't compatible with Python 3
    • Fixed cell.show
    Source code(tar.gz)
    Source code(zip)
  • v1.1.2(Jun 4, 2020)

    • Added scale-parameter to save_image
    • fixed .dxf-export in Cell
    • Waveguide.add_parameterized_path now also supports an array as path_derivative
    • fixed add_dlw_marker, origin can now also be a list
    Source code(tar.gz)
    Source code(zip)
  • v1.1.1(Feb 5, 2020)

    • Removed __future__ imports and (object) in class definitions for Python 2
    • create_holes_for_under_etching now allows ovals and rectangles
    • add_route_single_circle_to_port now tapers the waveguide to match the width of the port
    • Bugfixes
    Source code(tar.gz)
    Source code(zip)
  • v1.1.0(Dec 3, 2019)

    • Added support for slot waveguides and coplanar waveguides
    • Direct GDSII-export is now the standard GDSII-writer
    • Added function for generating vortex traps
    • Improved shape generation performance of waveguide
    • Strip to slot mode converter added
    • Bugfixes
    Source code(tar.gz)
    Source code(zip)
  • v1.0.4(Sep 3, 2019)

  • v1.0.3(Aug 6, 2019)

    • Structures in Cell are now converted individually for pattern export
    • annotate_write_fields now works with Cells instead of gdscad.Cells
    • fixed some bugs
    Source code(tar.gz)
    Source code(zip)
  • v1.0.2(Jul 30, 2019)

  • v1.0.1(Jul 29, 2019)

Certificate generating and sending system written in Python.

Certificate Generator & Sender How to use git clone https://github.com/saadhaxxan/Certificate-Generator-Sender.git cd Certificate-Generator-Sender Add

Saad Hassan 11 Dec 01, 2022
Graphical display tools, to help students debug their class implementations in the Carcassonne family of projects

carcassonne_tools Graphical display tools, to help students debug their class implementations in the Carcassonne family of projects NOTE NOTE NOTE The

1 Nov 08, 2021
HM02: Visualizing Interesting Datasets

HM02: Visualizing Interesting Datasets This is a homework assignment for CSCI 40 class at Claremont McKenna College. Go to the project page to learn m

Qiaoling Chen 11 Oct 26, 2021
Tidy data structures, summaries, and visualisations for missing data

naniar naniar provides principled, tidy ways to summarise, visualise, and manipulate missing data with minimal deviations from the workflows in ggplot

Nicholas Tierney 611 Dec 22, 2022
A small collection of tools made by me, that you can use to visualize atomic orbitals in both 2D and 3D in different aspects.

Orbitals in Python A small collection of tools made by me, that you can use to visualize atomic orbitals in both 2D and 3D in different aspects, and o

Prakrisht Dahiya 1 Nov 25, 2021
Custom Plotly Dash components based on Mantine React Components library

Dash Mantine Components Dash Mantine Components is a Dash component library based on Mantine React Components Library. It makes it easier to create go

Snehil Vijay 239 Jan 08, 2023
Here I plotted data for the average test scores across schools and class sizes across school districts.

HW_02 Here I plotted data for the average test scores across schools and class sizes across school districts. Average Test Score by Race This graph re

7 Oct 27, 2021
High performance, editable, stylable datagrids in jupyter and jupyterlab

An ipywidgets wrapper of regular-table for Jupyter. Examples Two Billion Rows Notebook Click Events Notebook Edit Events Notebook Styling Notebook Pan

J.P. Morgan Chase 75 Dec 15, 2022
Curvipy - The Python package for visualizing curves and linear transformations in a super simple way

Curvipy - The Python package for visualizing curves and linear transformations in a super simple way

Dylan Tintenfich 55 Dec 28, 2022
paintable GitHub contribute table

githeart paintable github contribute table how to use: Functions key color select 1,2,3,4,5 clear c drawing mode mode on turn off e print paint matrix

Bahadır Araz 27 Nov 24, 2022
script to generate HeN ipfs app exports of GLSL shaders

HeNerator A simple script to generate HeN ipfs app exports from any frag shader created with: GlslViewer GlslEditor The Book of Shaders glslCanvas VS

Patricio Gonzalez Vivo 22 Dec 21, 2022
Browse Dash docsets inside emacs

Helm Dash What's it This package uses Dash docsets inside emacs to browse documentation. Here's an article explaining the basic usage of it. It doesn'

504 Dec 15, 2022
A customized interface for single cell track visualisation based on pcnaDeep and napari.

pcnaDeep-napari A customized interface for single cell track visualisation based on pcnaDeep and napari. 👀 Under construction You can get test image

ChanLab 2 Nov 07, 2021
University of Missouri - Kansas City: CS451R: Capstone

CS451RC University of Missouri - Kansas City: CS451R: Capstone Installation cd git clone https://github.com/ala2q6/CS451RC.git cd CS451RC pip3 instal

Alex Arbuckle 1 Nov 17, 2021
Collection of scripts for making high quality beautiful math-related posters.

Poster Collection of scripts for making high quality beautiful math-related posters. The poster can have as large printing size as 3x2 square feet wit

Nattawut Phetmak 3 Jun 09, 2022
A simple Monte Carlo simulation using Python and matplotlib library

Monte Carlo python simulation Install linux dependencies sudo apt update sudo apt install build-essential \ software-properties-commo

Samuel Terra 2 Dec 13, 2021
SummVis is an interactive visualization tool for text summarization.

SummVis is an interactive visualization tool for analyzing abstractive summarization model outputs and datasets.

Robustness Gym 246 Dec 08, 2022
Simple plotting for Python. Python wrapper for D3xter - render charts in the browser with simple Python syntax.

PyDexter Simple plotting for Python. Python wrapper for D3xter - render charts in the browser with simple Python syntax. Setup $ pip install PyDexter

D3xter 31 Mar 06, 2021
This component provides a wrapper to display SHAP plots in Streamlit.

streamlit-shap This component provides a wrapper to display SHAP plots in Streamlit.

Snehan Kekre 30 Dec 10, 2022
Plot-configurations for scientific publications, purely based on matplotlib

TUEplots Plot-configurations for scientific publications, purely based on matplotlib. Usage Please have a look at the examples in the example/ directo

Nicholas Krämer 487 Jan 08, 2023