Graphing communities on Twitch.tv in a visually intuitive way

Overview

VisualizingTwitchCommunities

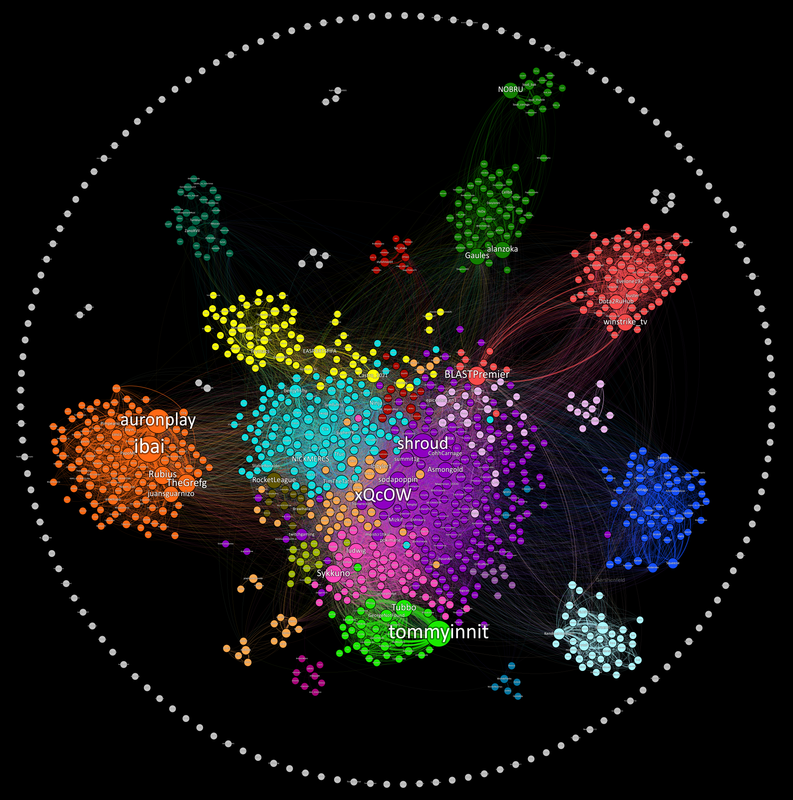
This project maps communities of streamers on Twitch.tv based on shared viewership. The data is collected from the Twitch API and visualized in Gephi.

Results

Twitch-Communities-High-Res.png

I wrote an article on TowardsDataScience here

If your curious about how to read this graph and why I made it, check out the article.

How can I mess with the graph?

I made the graph in a free data visualization tool called Gephi. Download it here The data set is in Visulization/GephiData . In gephi go to laboratory and import the edge file as an edgelist. Then import the label file as a node list. From there you can go to overview and run a modularity analysis on the nodes to detect communities.

How can I collect more data?

The DataCollection folder has a script called main that can be ran to collect the top 100 streams and all their viewers and save it to a csv. You can use the windows task scheduler to run this task at any time interval you like and build up data over long periods of time.
Owner
Kiran Gershenfeld
Making Lives Easier With Computers
Kiran Gershenfeld
Create artistic visualisations with your exercise data (Python version)

strava_py Create artistic visualisations with your exercise data (Python version). This is a port of the R strava package to Python. Examples Facets A

Marcus Volz 53 Dec 28, 2022
Here I plotted data for the average test scores across schools and class sizes across school districts.

HW_02 Here I plotted data for the average test scores across schools and class sizes across school districts. Average Test Score by Race This graph re

7 Oct 27, 2021
Some problems of SSLC ( High School ) before outputs and after outputs

Some problems of SSLC ( High School ) before outputs and after outputs 1] A Python program and its output (output1) while running the program is given

Fayas Noushad 3 Dec 01, 2021
Blender addon that creates a temporary window of any type from the 3D View.

CreateTempWindow2.8 Blender addon that creates a temporary window of any type from the 3D View. Features Can the following window types: 3D View Graph

3 Nov 27, 2022
NW 2022 Hackathon Project by Angelique Clara Hanzel, Aryan Sonik, Damien Fung, Ramit Brata Biswas

Spiral-Data-Visualizer NW 2022 Hackathon Project by Angelique Clara Hanzell, Aryan Sonik, Damien Fung, Ramit Brata Biswas Description This project vis

Damien Fung 2 Jan 16, 2022
Make scripted visualizations in blender

Scripted visualizations in blender The goal of this project is to script 3D scientific visualizations using blender. To achieve this, we aim to bring

Praneeth Namburi 10 Jun 01, 2022
Splore - a simple graphical interface for scrolling through and exploring data sets of molecules

Scroll through and exPLORE molecule sets The splore framework aims to offer a si

3 Jun 18, 2022
This is a place where I'm playing around with pandas to analyze data in a csv/excel file.

pandas-csv-excel-analysis This is a place where I'm playing around with pandas to analyze data in a csv/excel file. 0-start A very simple cheat sheet

Chuqin 3 Oct 05, 2022
Info for The Great DataTas plot-a-thon

The Great DataTas plot-a-thon Datatas is organising a Data Visualisation competition: The Great DataTas plot-a-thon We will be using Tidy Tuesday data

2 Nov 21, 2021
An XLSX spreadsheet renderer for Django REST Framework.

drf-renderer-xlsx provides an XLSX renderer for Django REST Framework. It uses OpenPyXL to create the spreadsheet and returns the data.

The Wharton School 166 Dec 01, 2022
CLAHE Contrast Limited Adaptive Histogram Equalization

A simple code to process images using contrast limited adaptive histogram equalization. Image processing is becoming a major part of data processig.

Happy N. Monday 4 May 18, 2022
Visualize data of Vietnam's regions with interactive maps.

Plotting Vietnam Development Map This is my personal project that I use plotly to analyse and visualize data of Vietnam's regions with interactive map

1 Jun 26, 2022
basemap - Plot on map projections (with coastlines and political boundaries) using matplotlib.

Basemap Plot on map projections (with coastlines and political boundaries) using matplotlib. ⚠️ Warning: this package is being deprecated in favour of

Matplotlib Developers 706 Dec 28, 2022
Movies-chart - A CLI app gets the top 250 movies of all time from imdb.com and the top 100 movies from rottentomatoes.com

movies-chart This CLI app gets the top 250 movies of all time from imdb.com and

3 Feb 17, 2022
demir.ai Dataset Operations

demir.ai Dataset Operations With this application, you can have the empty values (nan/null) deleted or filled before giving your dataset to machine le

Ahmet Furkan DEMIR 8 Nov 01, 2022
Matplotlib JOTA style for making figures

Matplotlib JOTA style for making figures This repo has Matplotlib JOTA style to format plots and figures for publications and presentation.

JOTA JORNALISMO 2 May 05, 2022
Tidy data structures, summaries, and visualisations for missing data

naniar naniar provides principled, tidy ways to summarise, visualise, and manipulate missing data with minimal deviations from the workflows in ggplot

Nicholas Tierney 611 Dec 22, 2022
A flexible tool for creating, organizing, and sharing visualizations of live, rich data. Supports Torch and Numpy.

Visdom A flexible tool for creating, organizing, and sharing visualizations of live, rich data. Supports Python. Overview Concepts Setup Usage API To

FOSSASIA 9.4k Jan 07, 2023
Realtime Web Apps and Dashboards for Python and R

H2O Wave Realtime Web Apps and Dashboards for Python and R New! R Language API Build and control Wave dashboards using R! New! Easily integrate AI/ML

H2O.ai 3.4k Jan 06, 2023
This is a small repository for me to implement my simply Data Visualisation skills through Python.

Data Visualisations This is a small repository for me to implement my simply Data Visualisation skills through Python. Steam Population Chart from 10/

9 Dec 31, 2021